Analyse de données métagénomiques 16S - FROGS
Master BMC - Atelier Biodiversité microbienne
Olivier Rué 
MaIAGE - Migale
September 22, 2023
What is FROGS
![]()
- FROGS is a software package for accurate, simple and robust processing of metabarcoding sequencing reads.
- FROGS uses standard methods and tools combined with original and innovative approaches
- FROGS currently offers 29 tools, numerous graphs, statistics and functional inference, providing biologists with enhanced support for their analyses.
- FROGS use is open to both novices and experts, thanks to the ability to launch tools via the Galaxy platforms or via the command line.
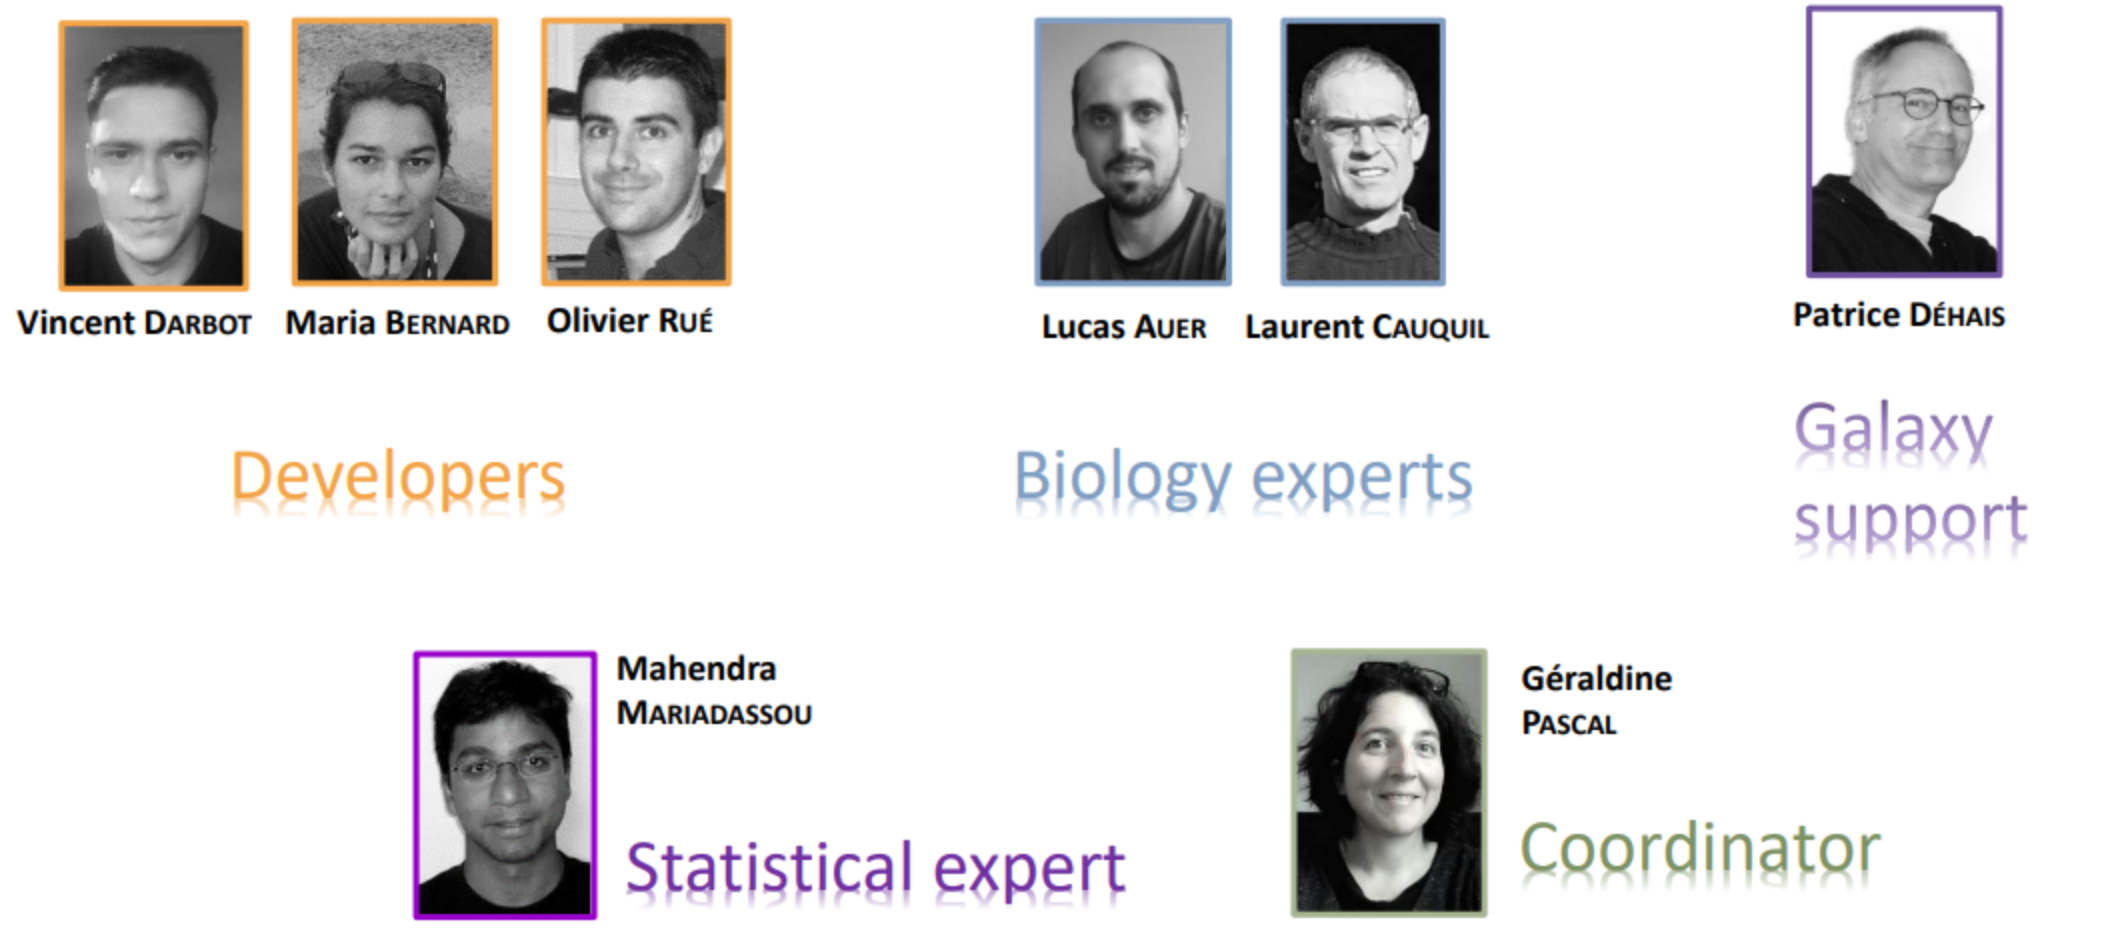
FROGS team
- FROGS is a INRAE collaborative project since 2015
![]()
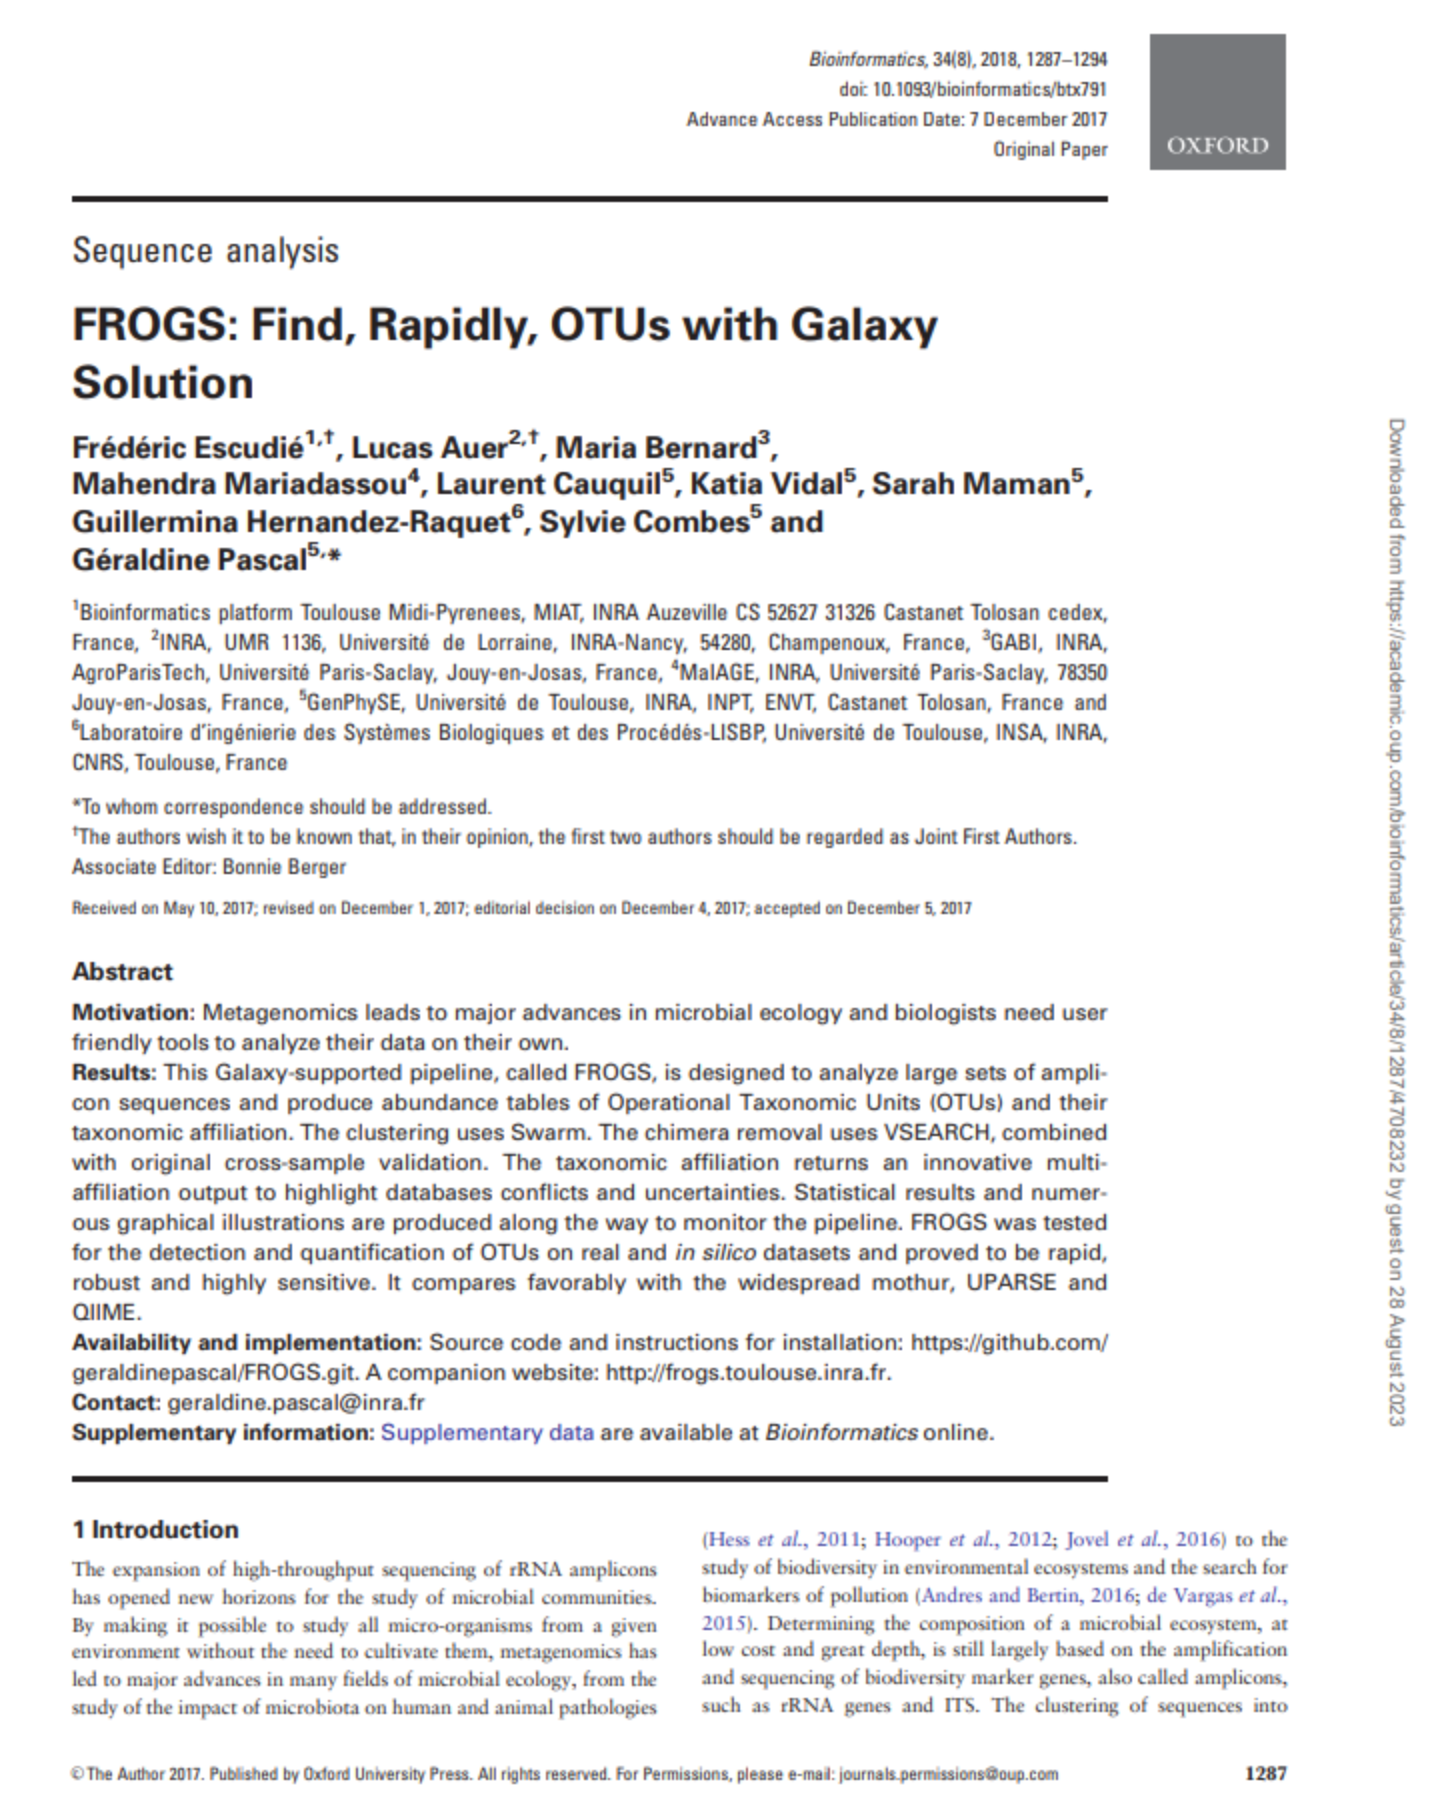
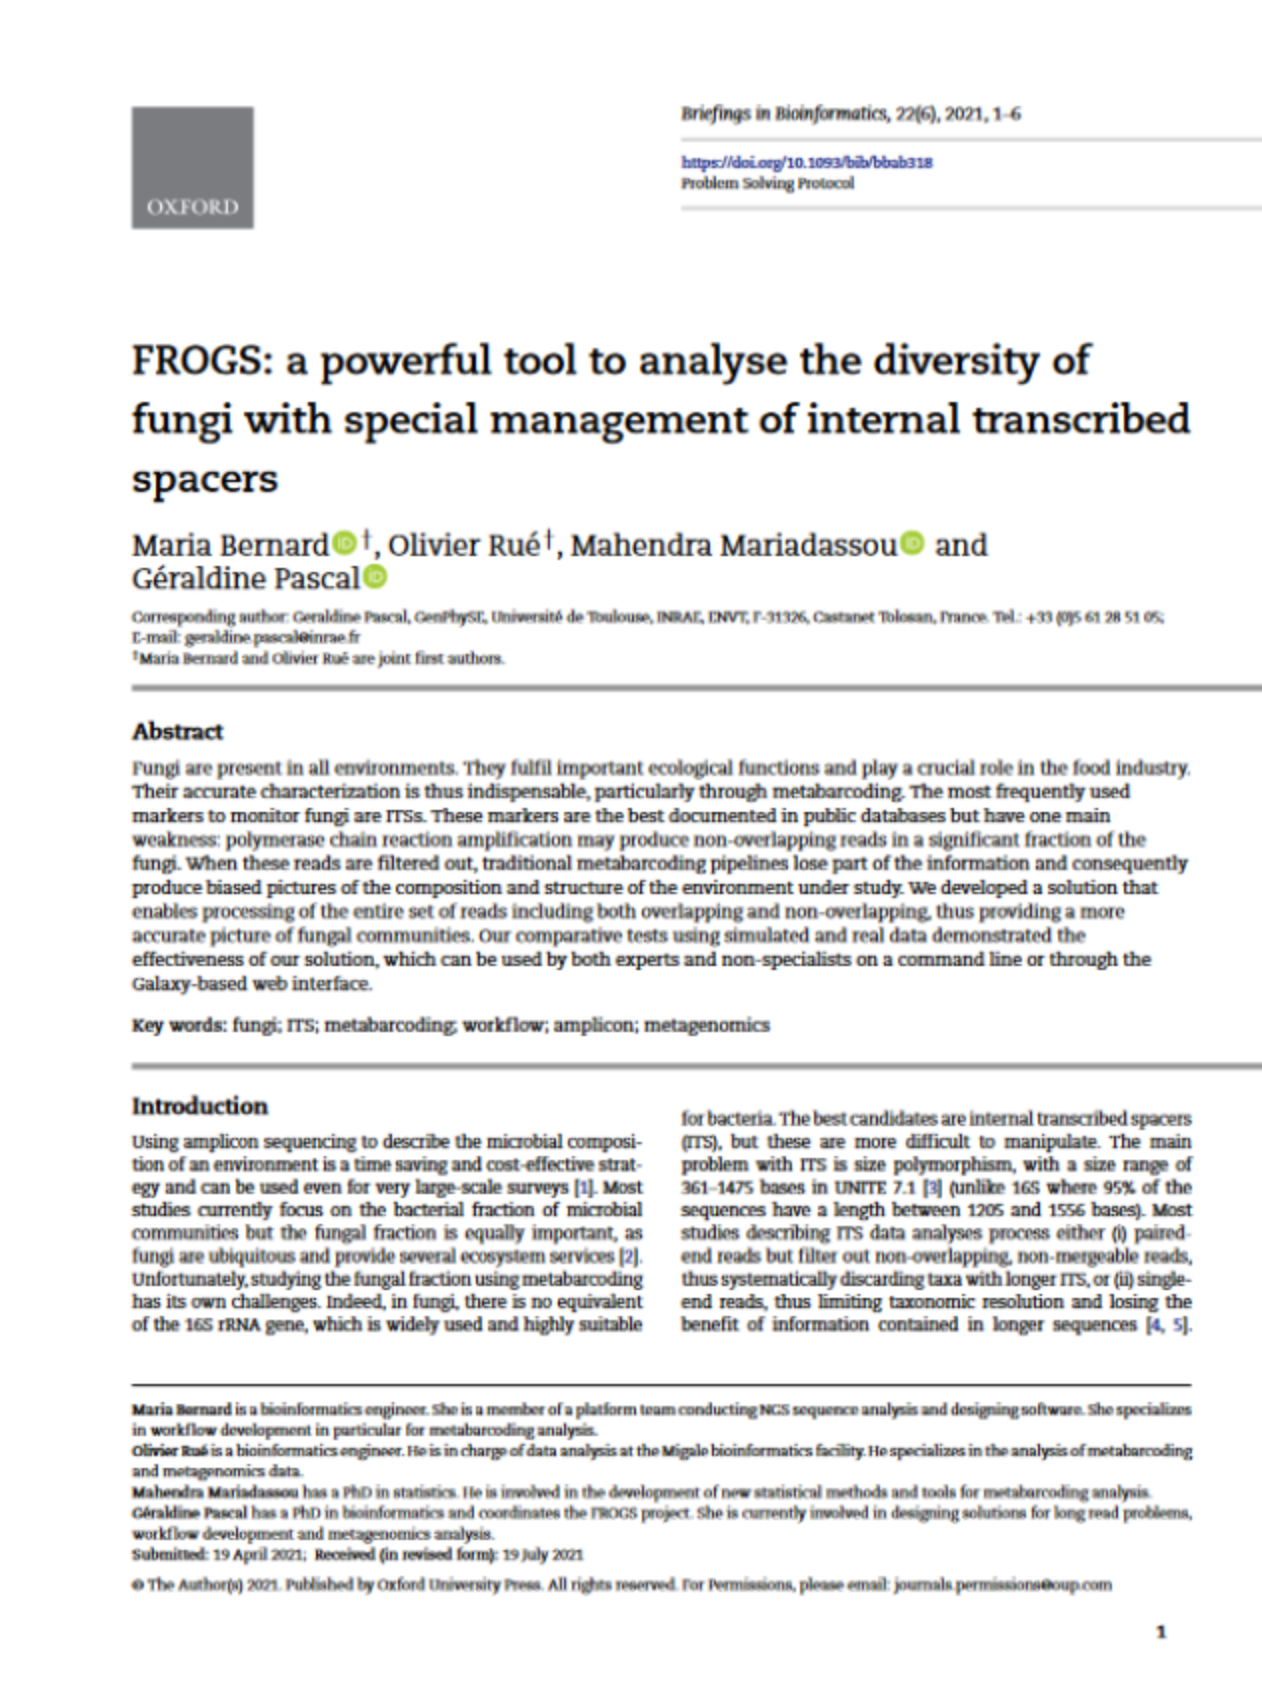
FROGS articles
How to use FROGS
![]()
- Command line
remove_chimera.py
  --input-biom clustering.biom \
  --input-fasta clustering.fasta \
  --non-chimera remove_chimera.fasta \
  --out-abundance remove_chimera.biom \
  --summary remove_chimera.html
- Galaxy instances via web
![]()
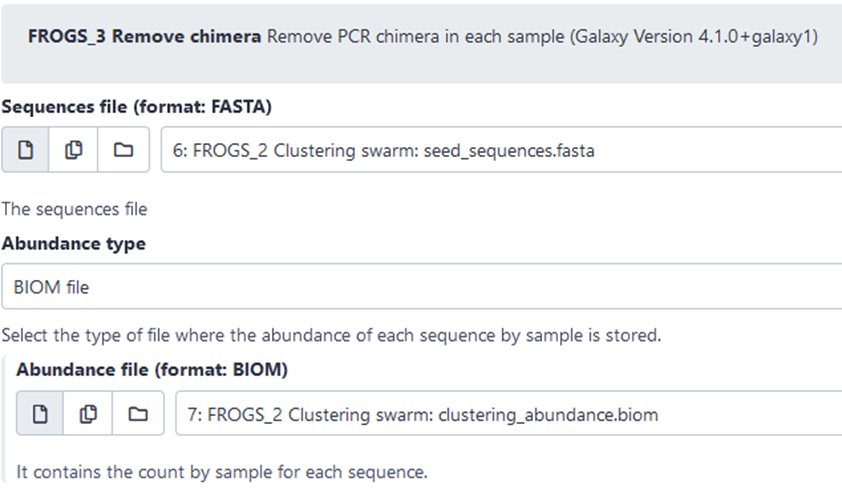
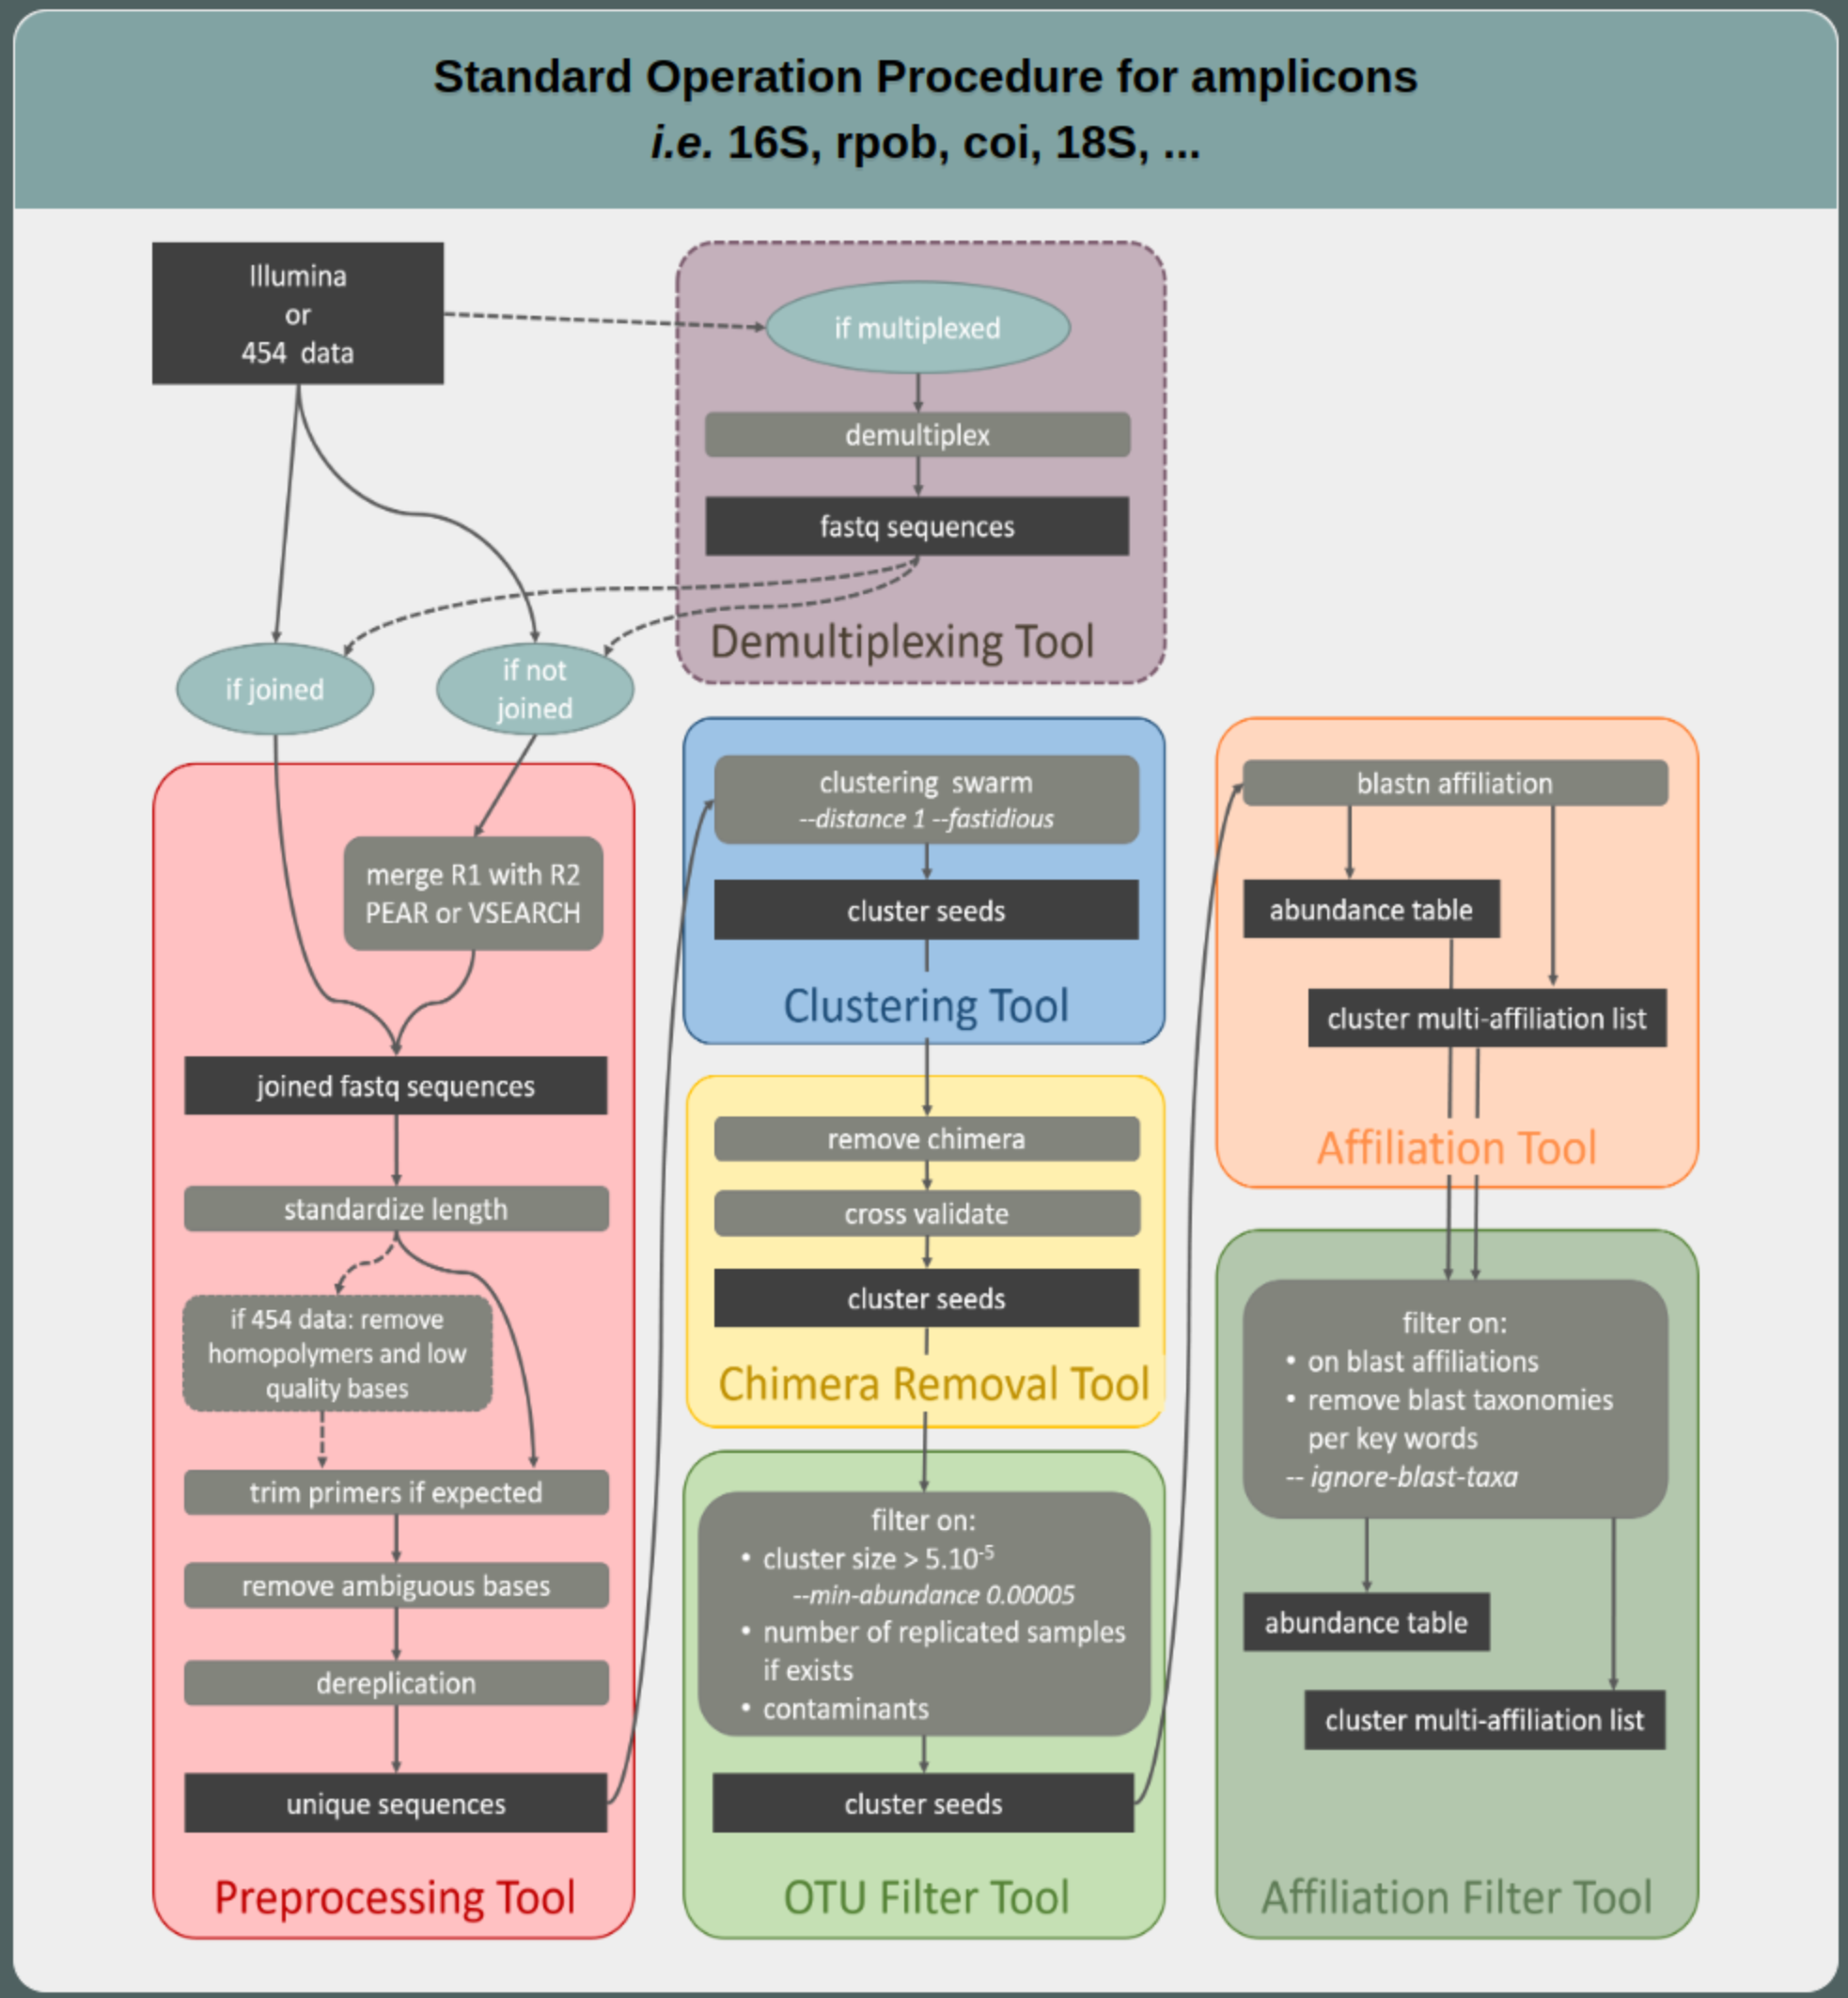
FROGS 16S SOP
FROGS docs and help
![]()
- Website: https://frogs.toulouse.inrae.fr
- Github: https://github.com/geraldinepascal/FROGS.git
- Newsletter: subscription request at frogs-support@inrae.fr
- Need help
- frogs-support@inrae.fr for generic questions
- help-migale@inrae.fr for bugs/quotas/errors with Galaxy Migale instance
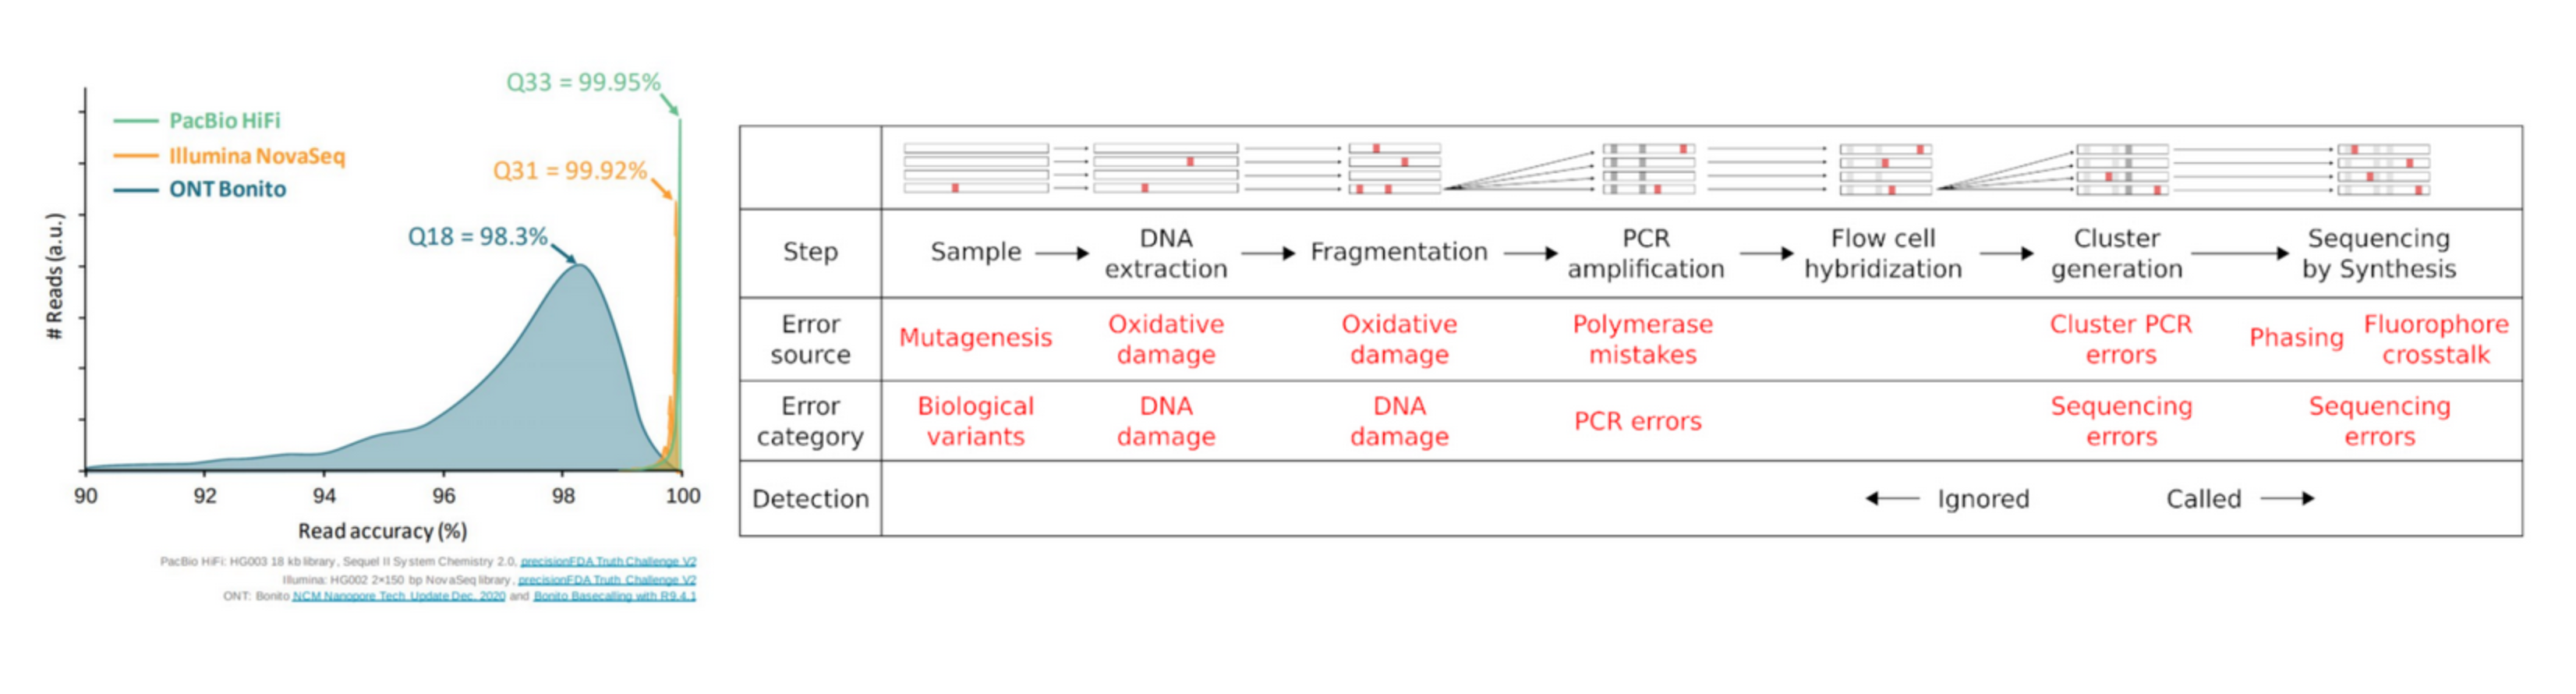
Quality score encoding
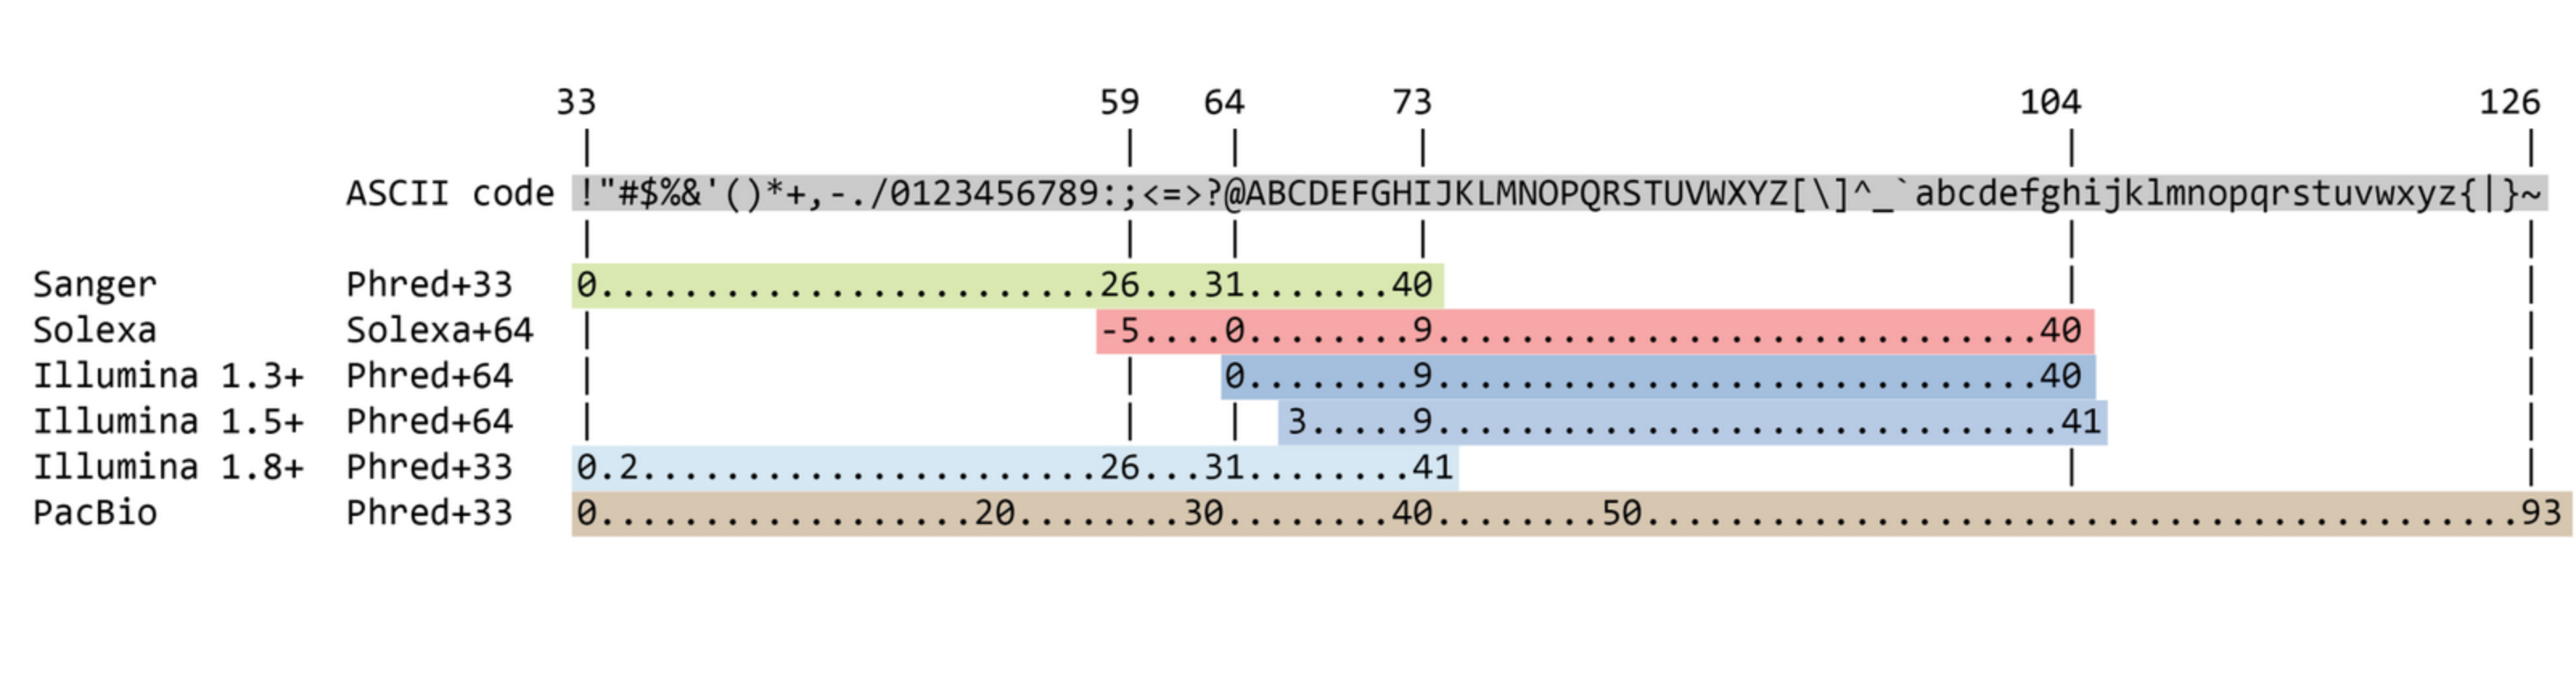
Quality score
Measure of the quality of the identification of the nucleobases generated by automated DNA sequencing
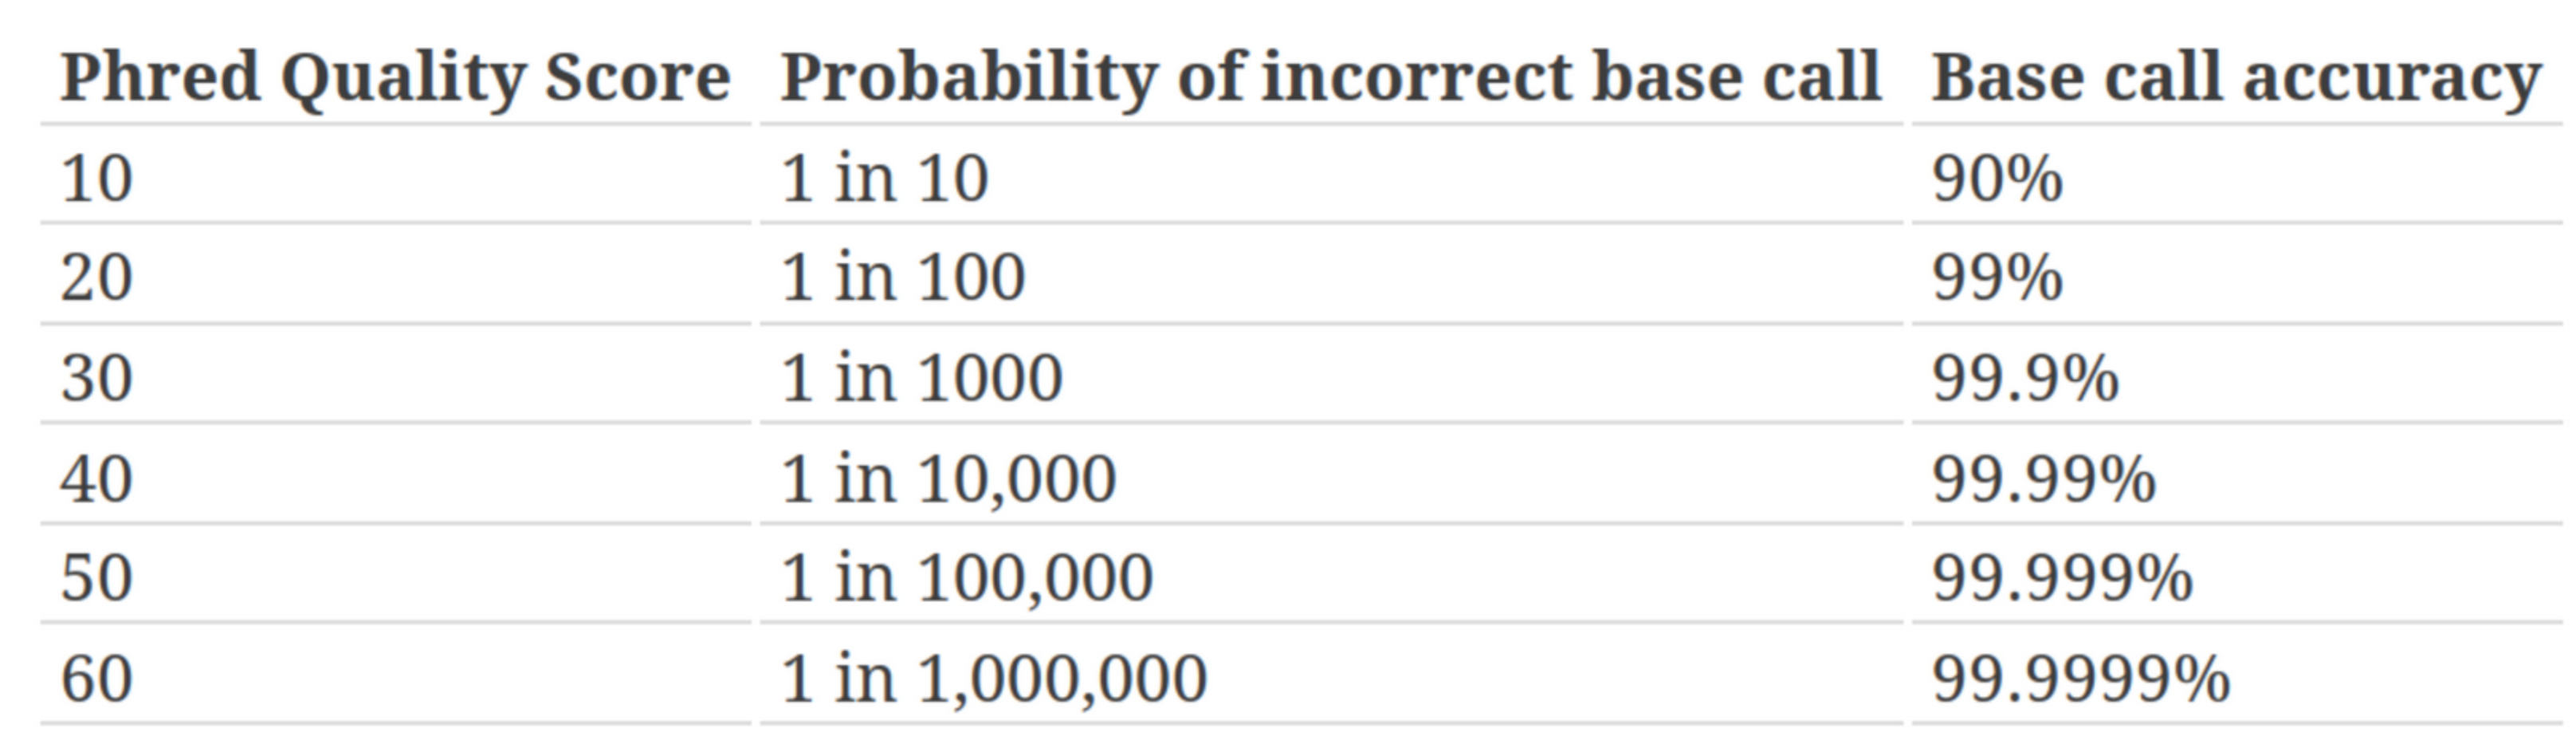
Reads are not perfect
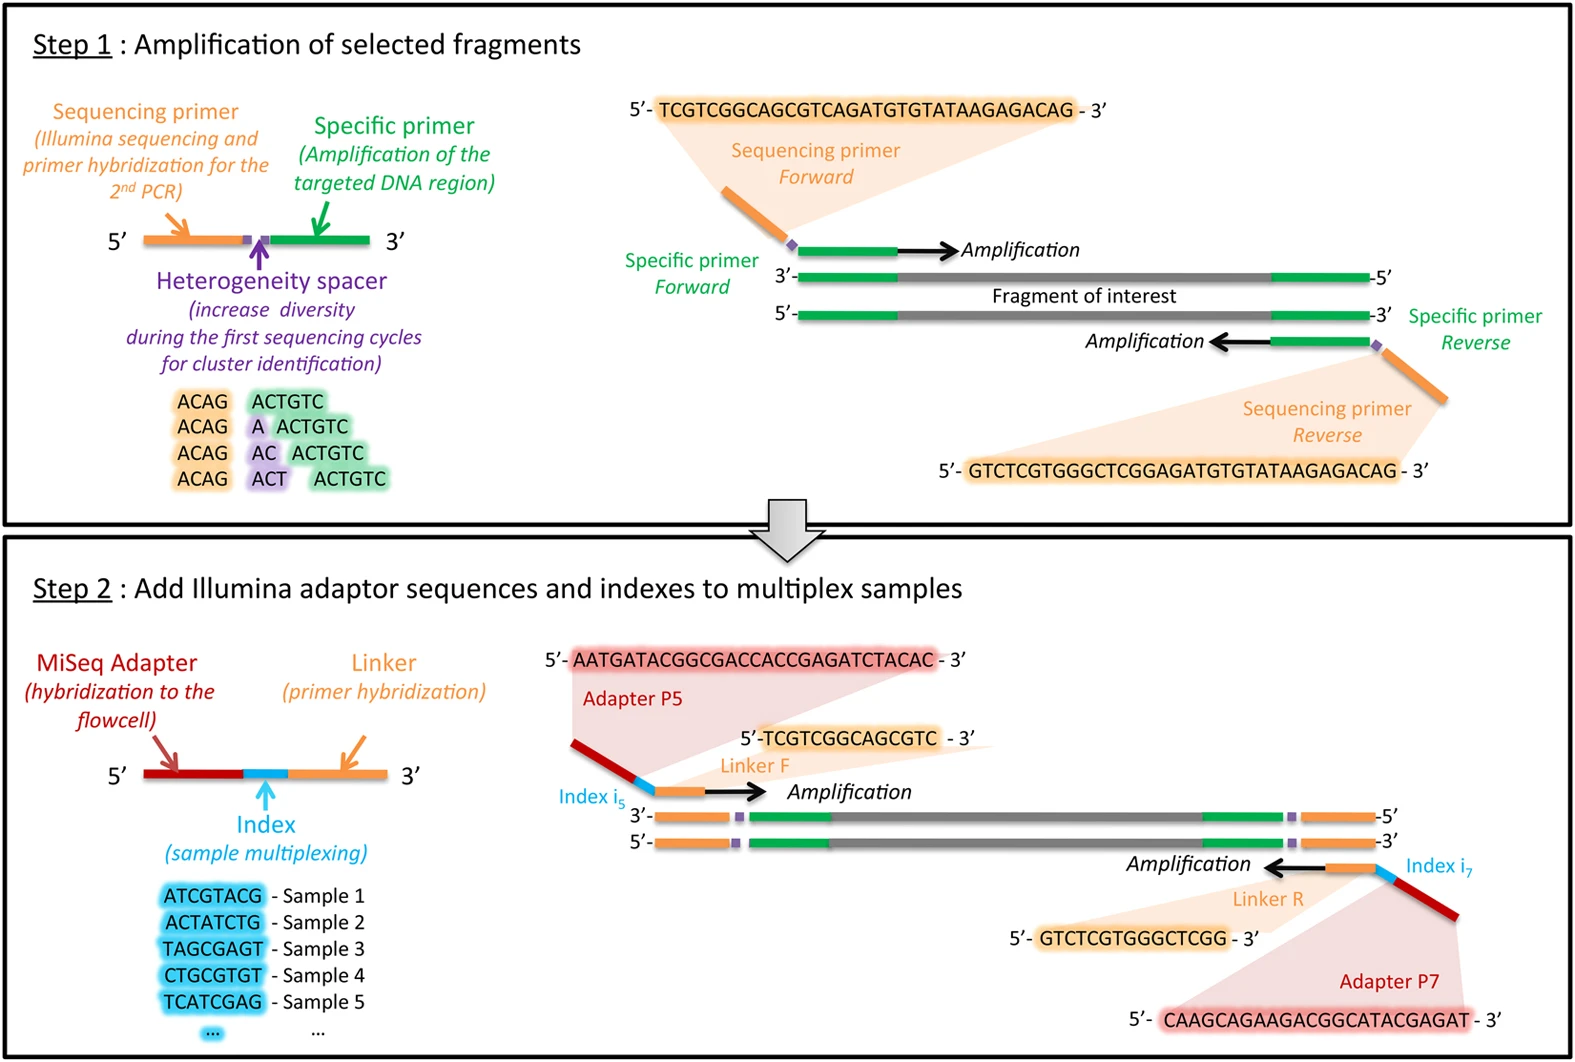
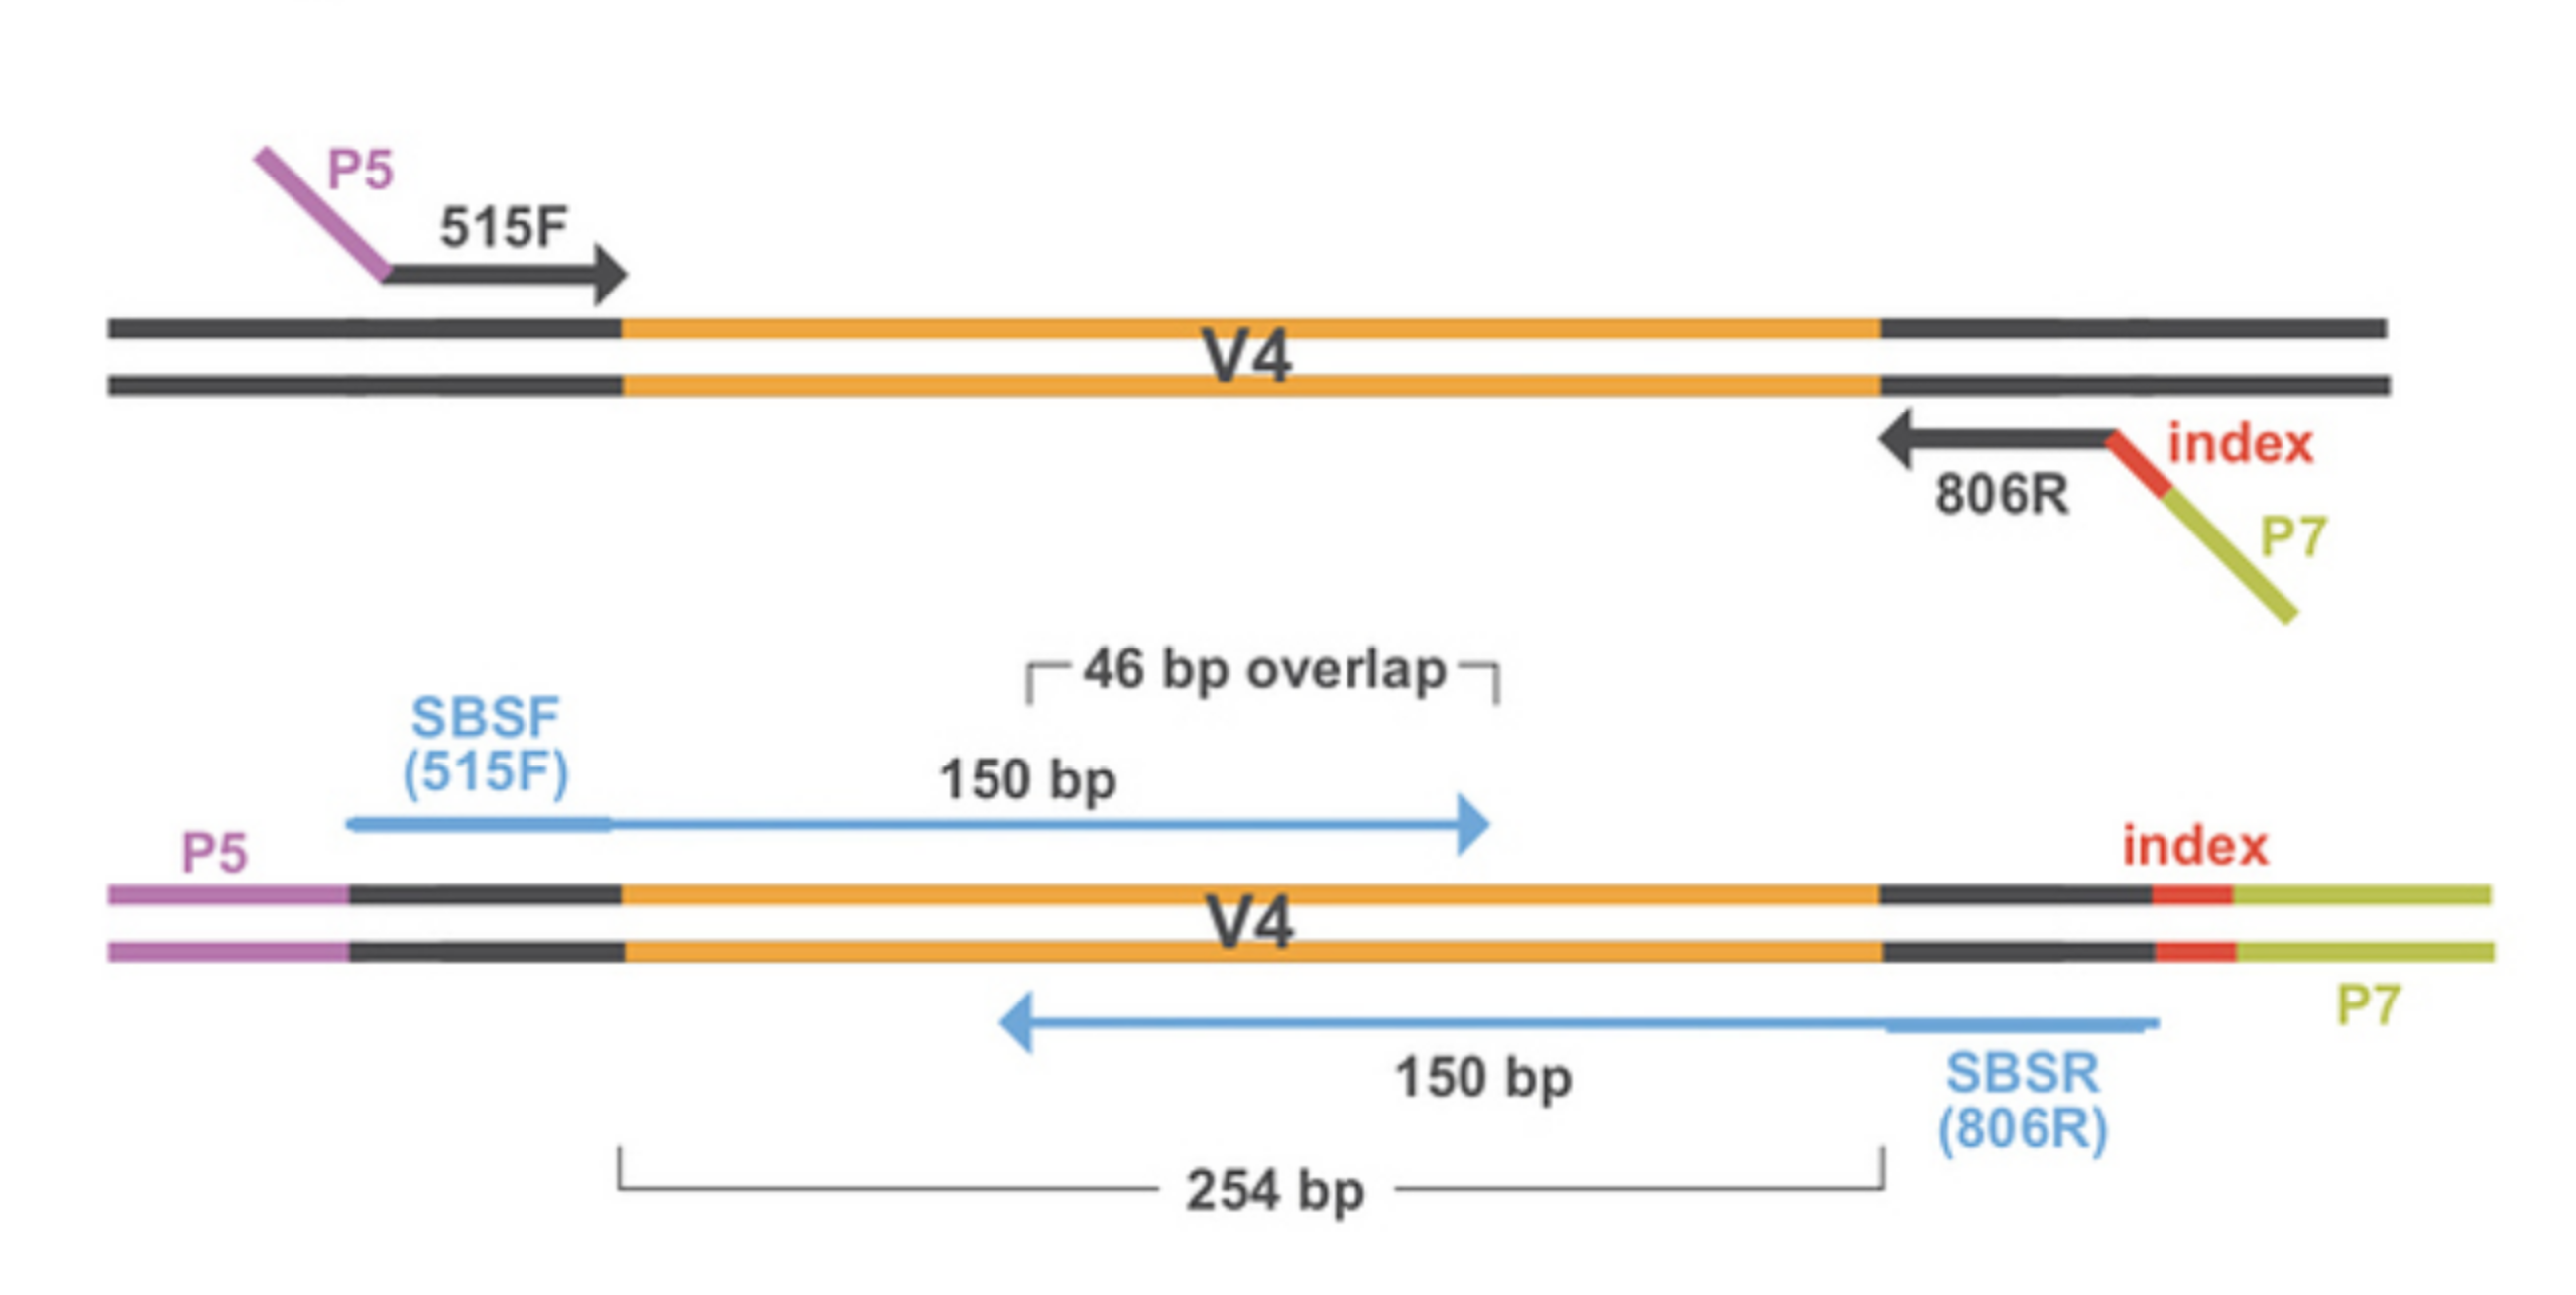
Multiplexing principle
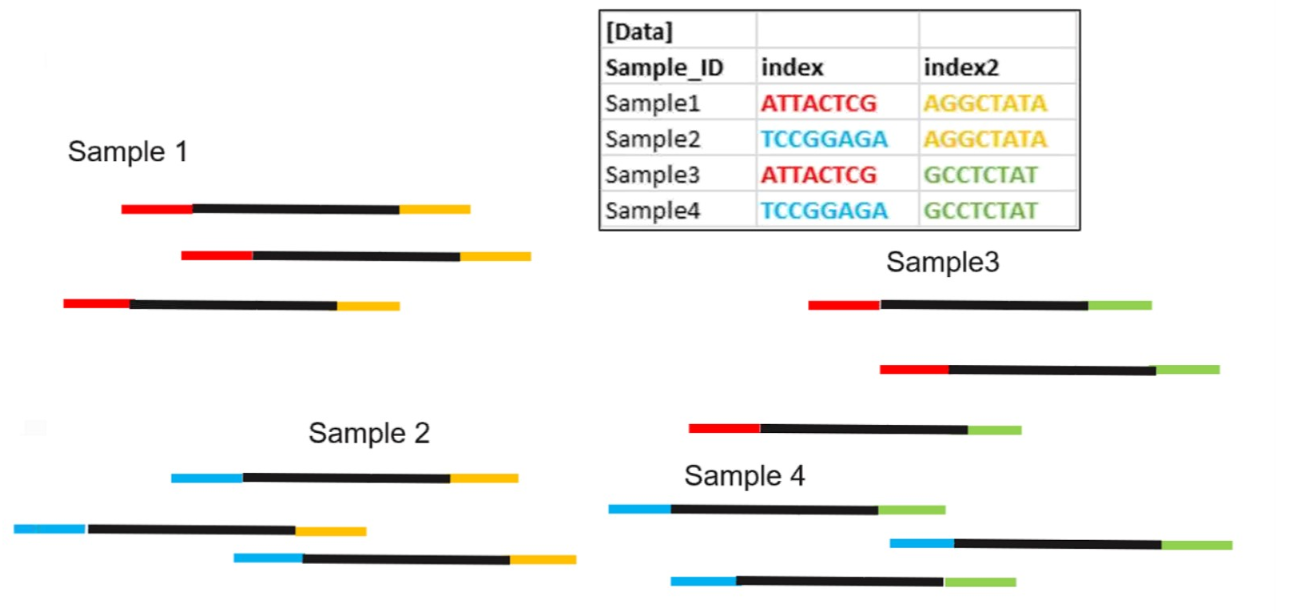
Demultiplexing by bioinformatics
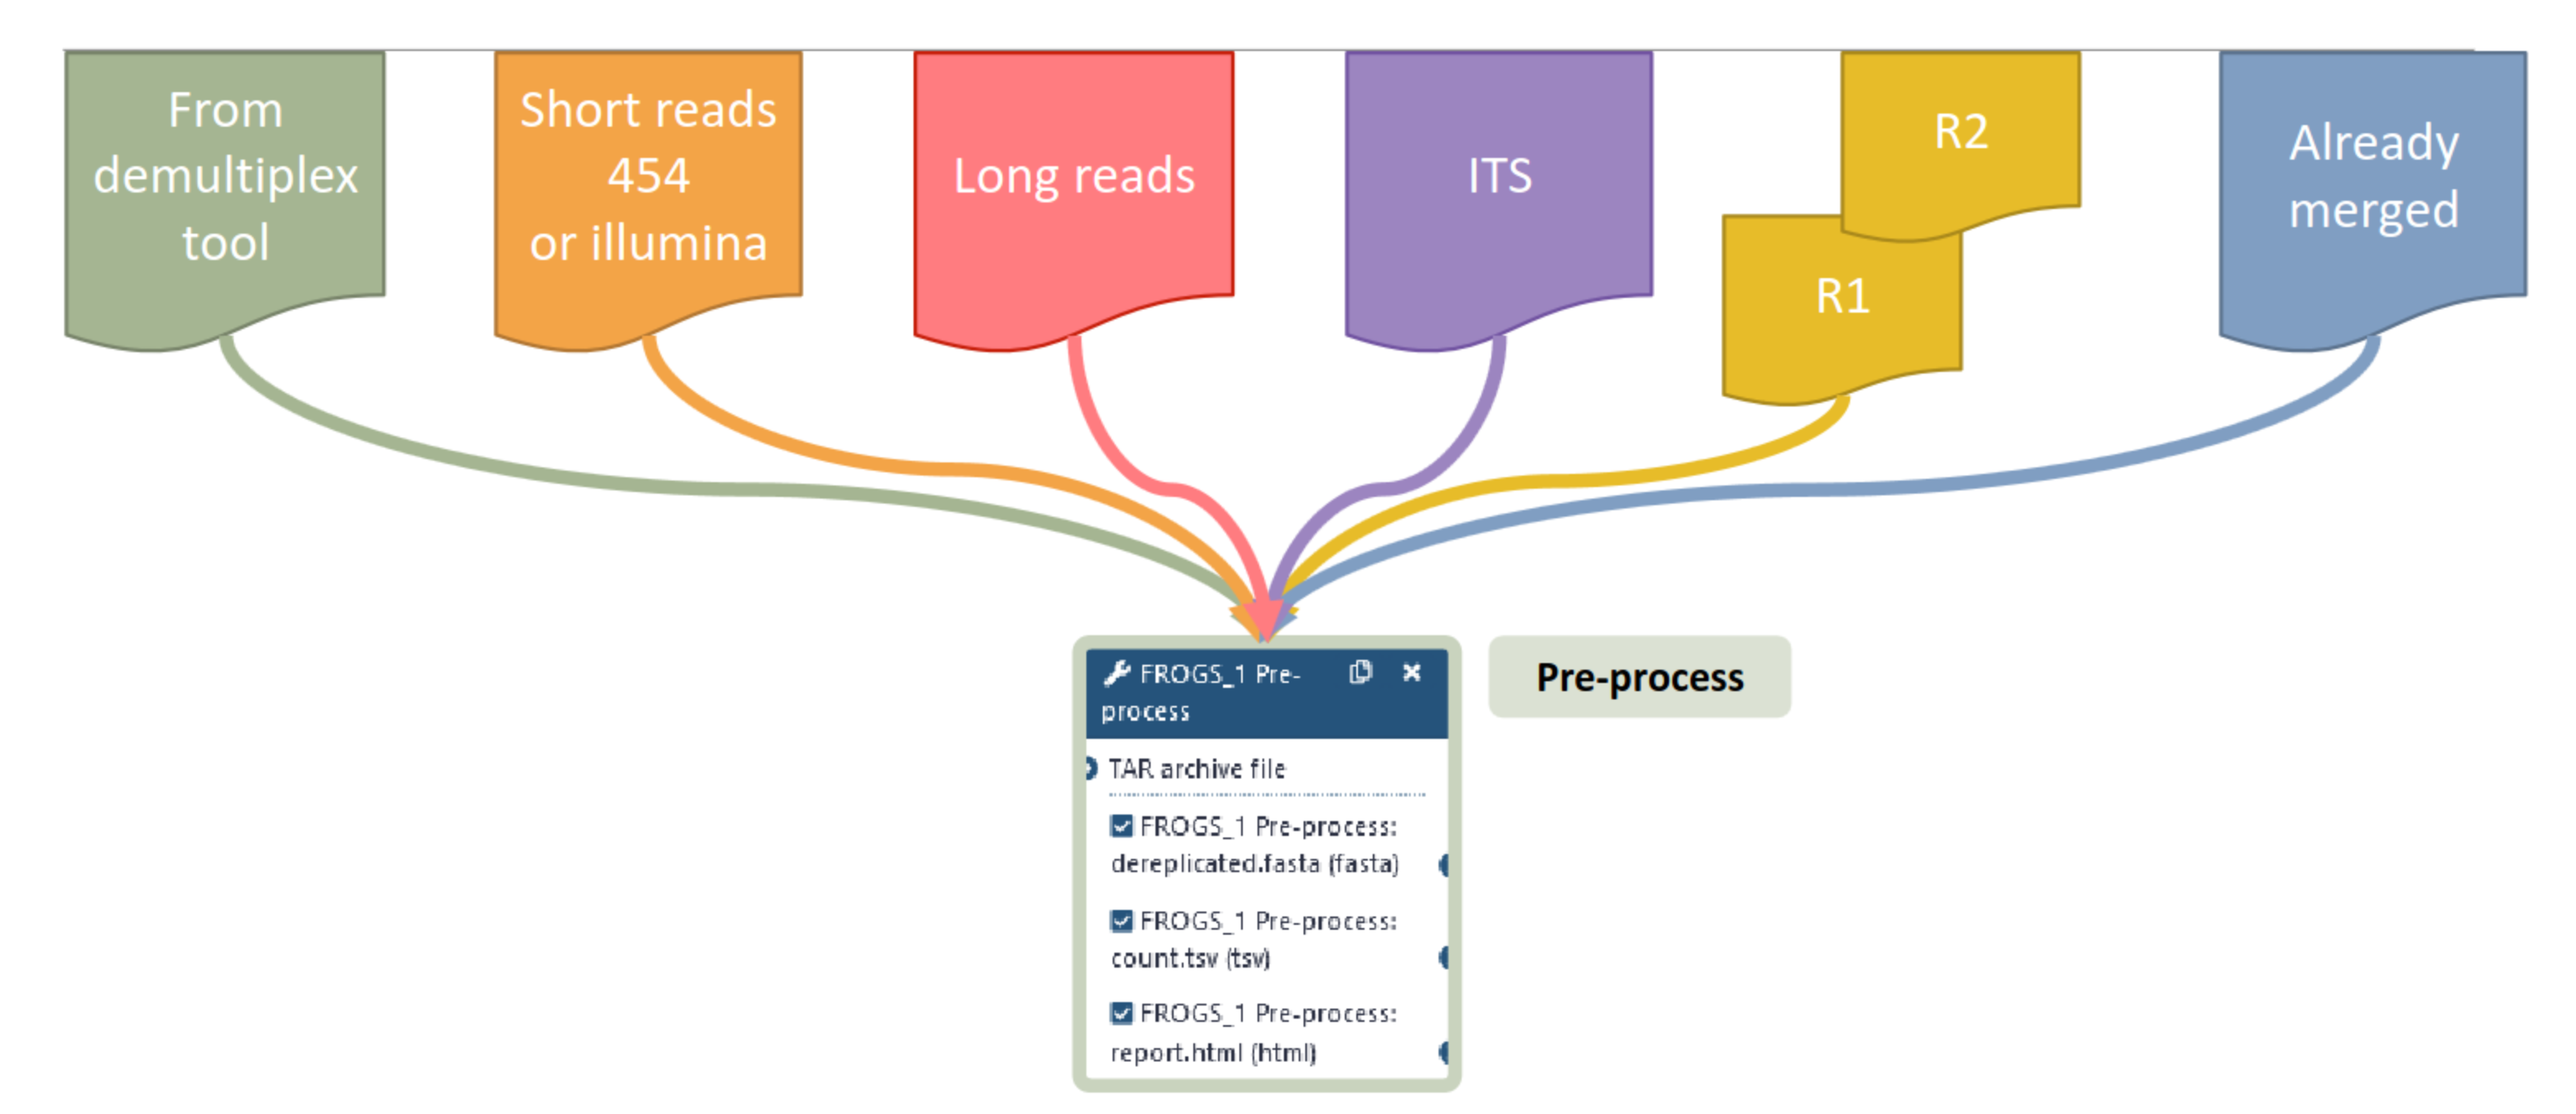
FROGS preprocess deals with…
Merging of paired-end reads
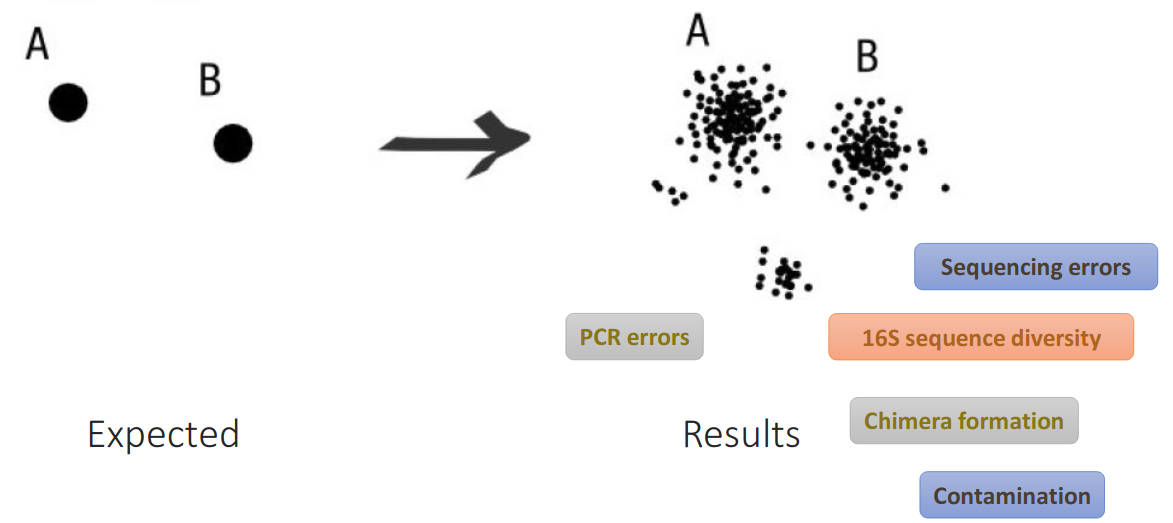
Sequencing data are noised
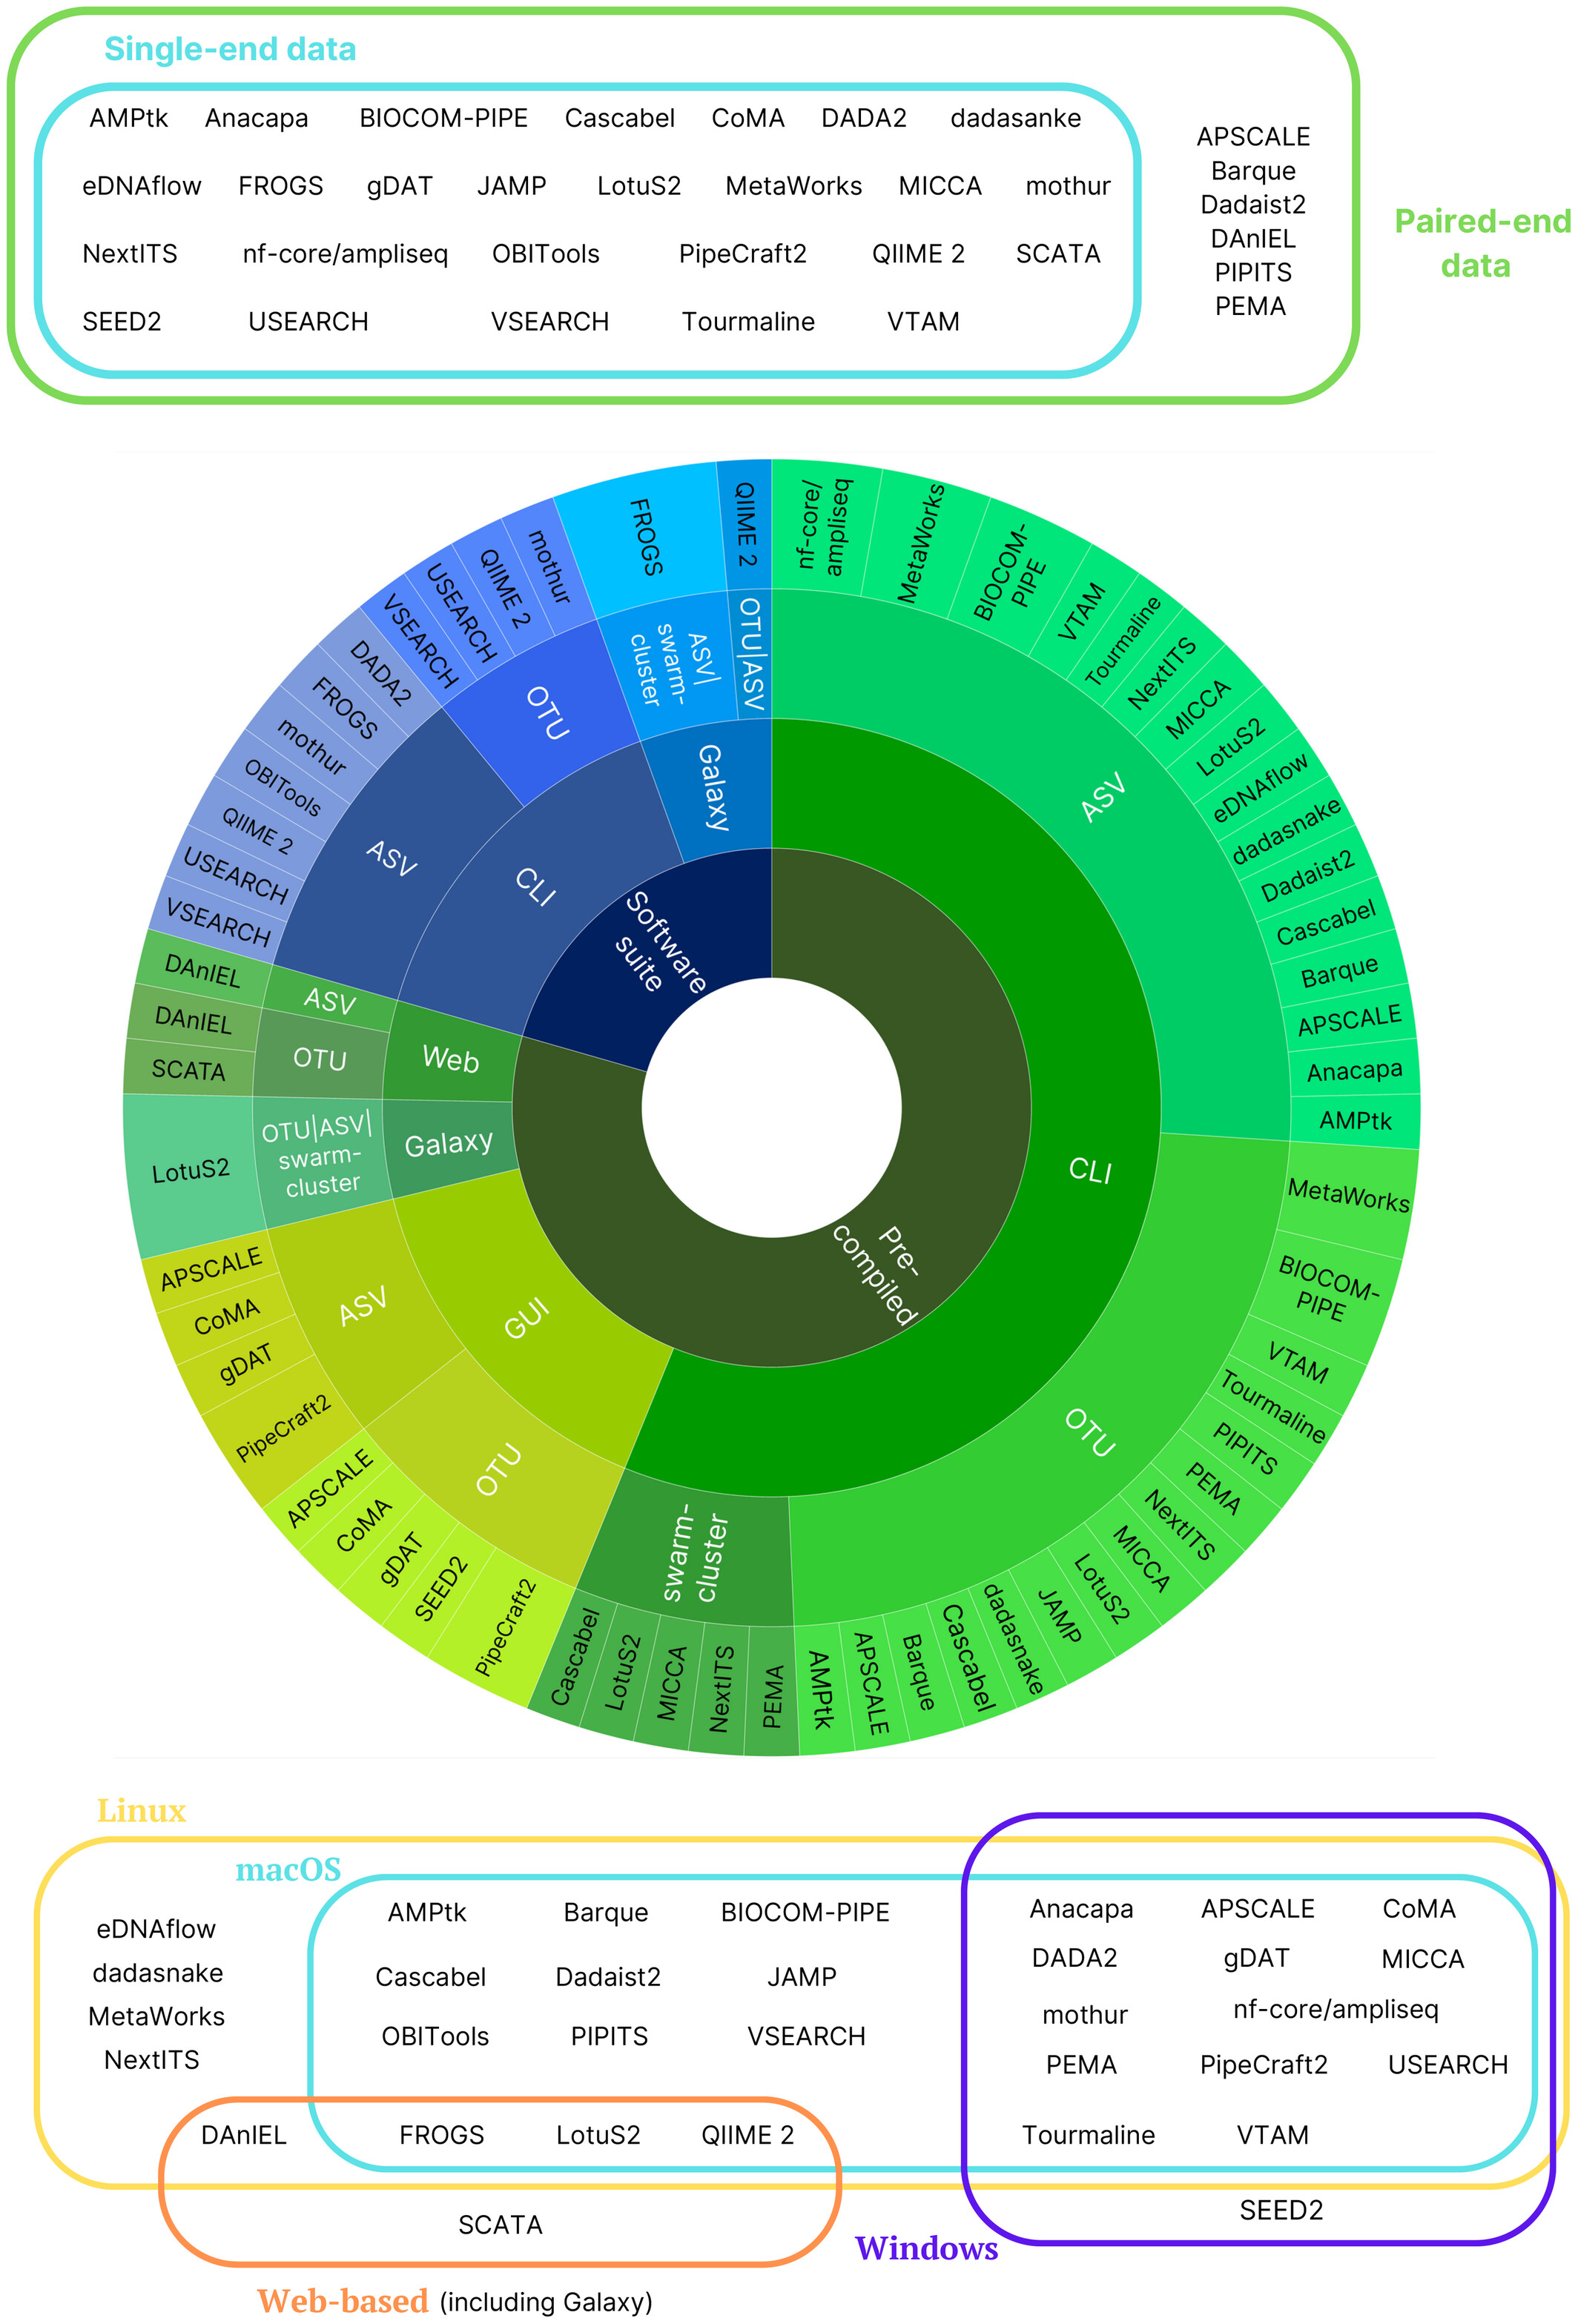
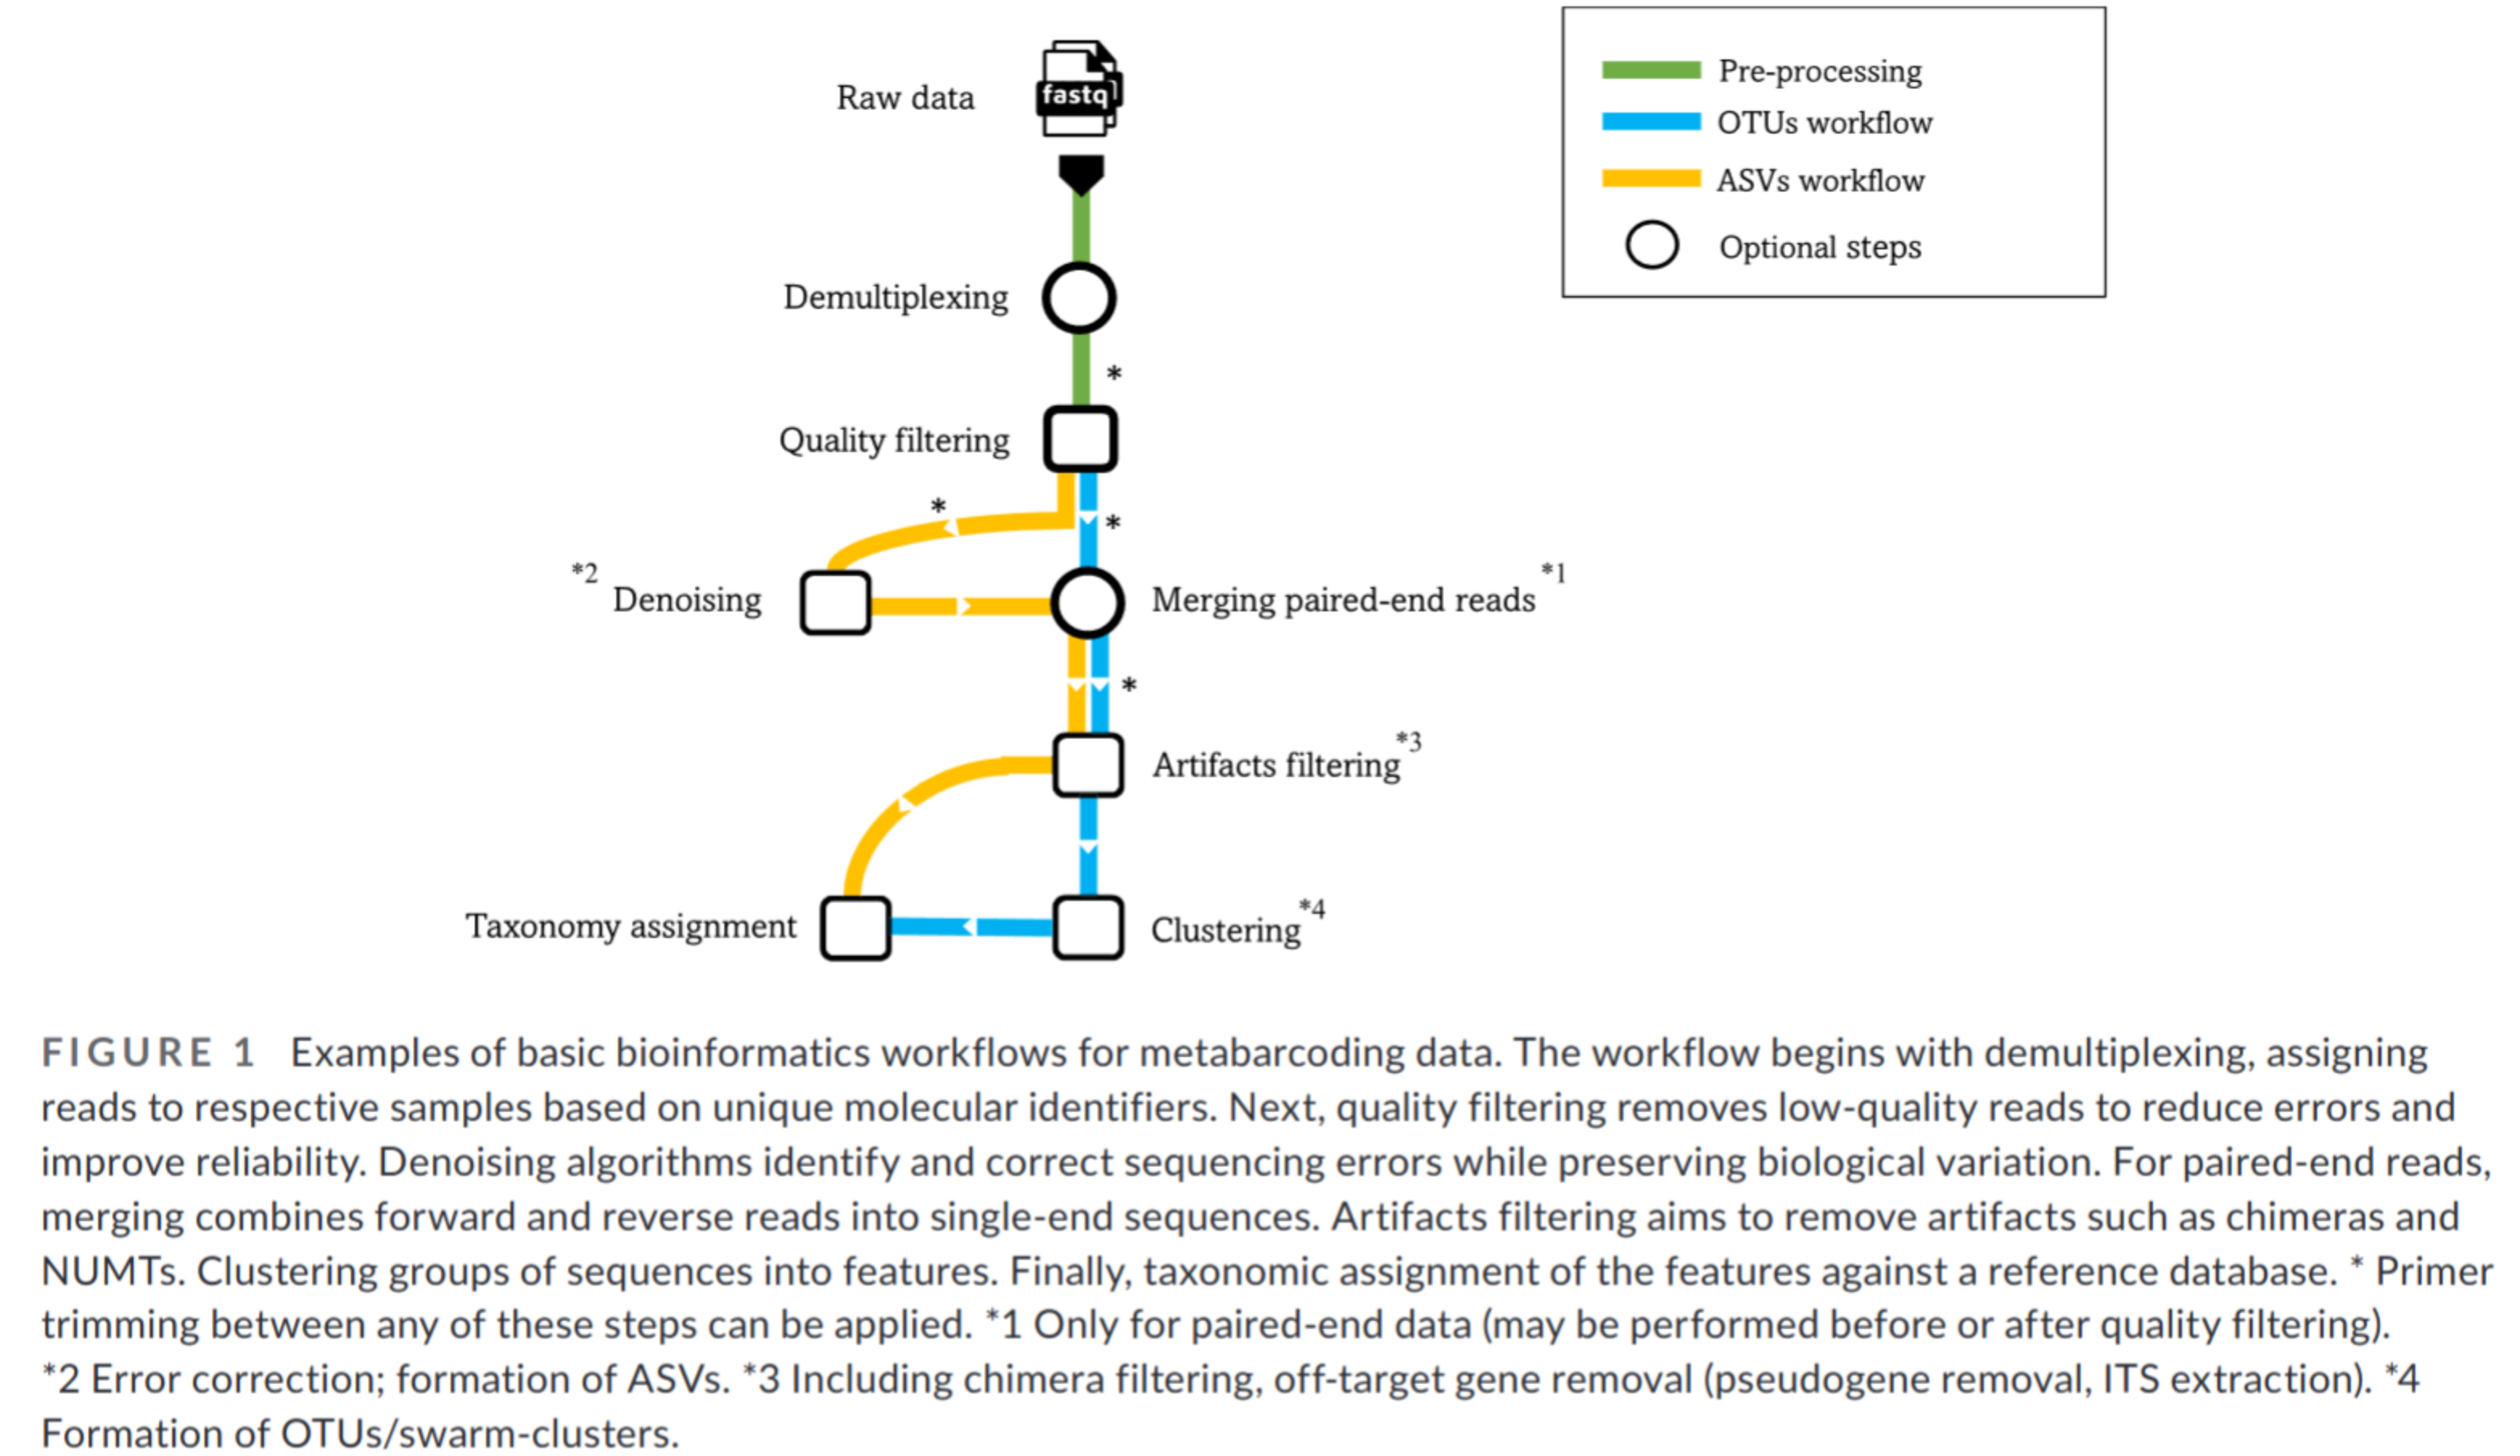
Methods classification
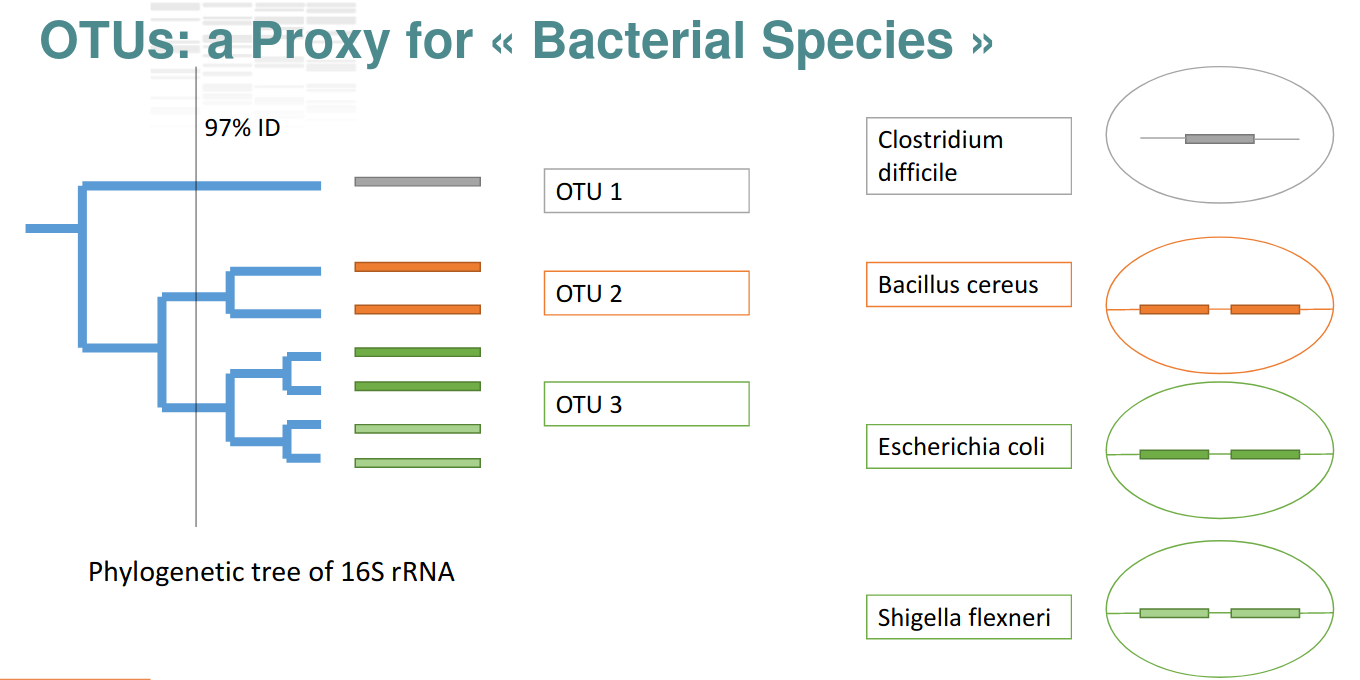
OTU paradigm
- Operational Taxonomic Unit
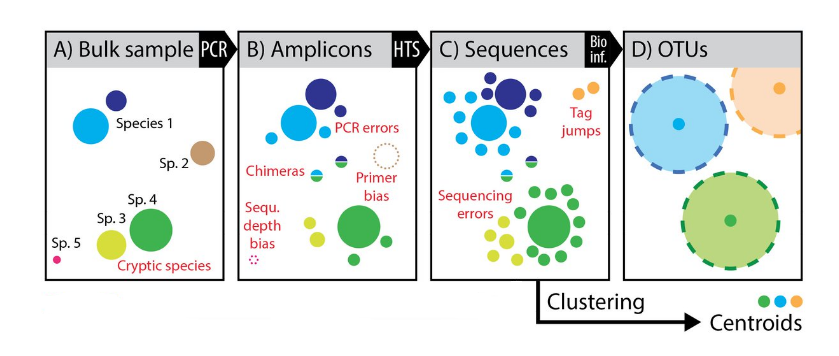
Operational Taxonomic Units
Operational Taxonomic Units
Operational Taxonomic Units
Operational Taxonomic Units
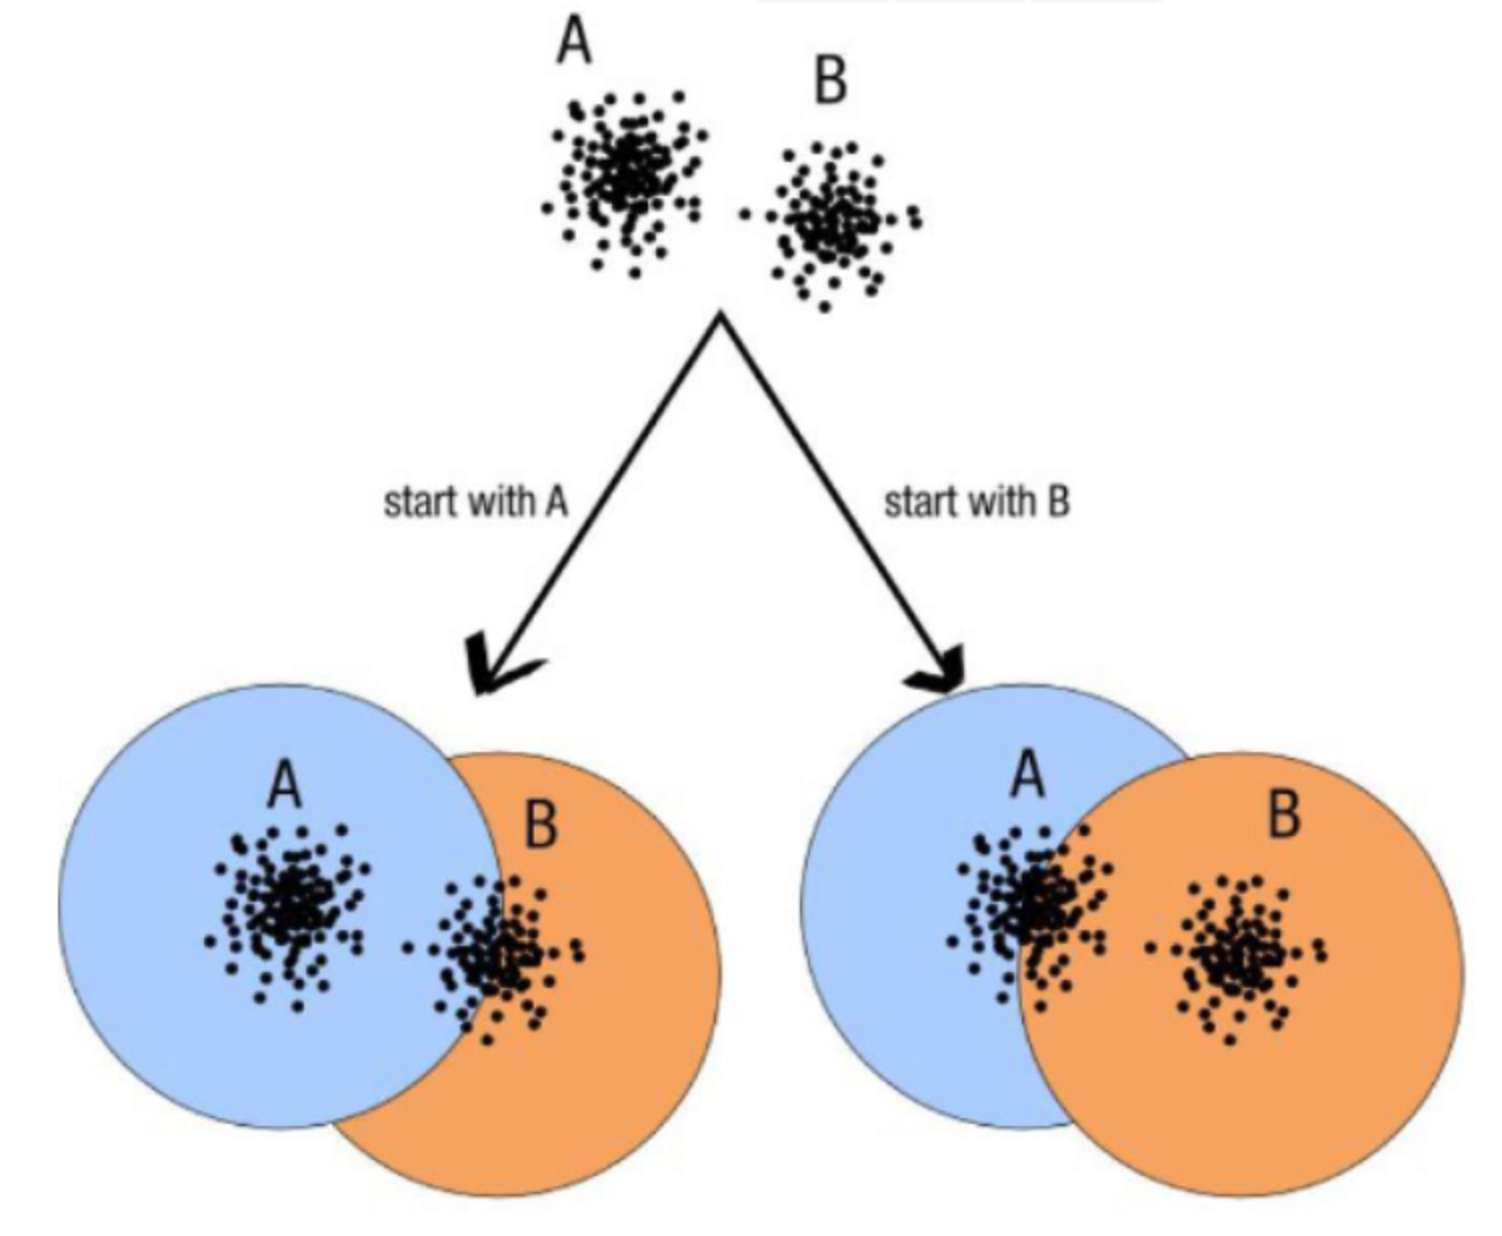
- OTUs composition is input-order depenent
ASV paradigm
- Amplicon Sequence Variants
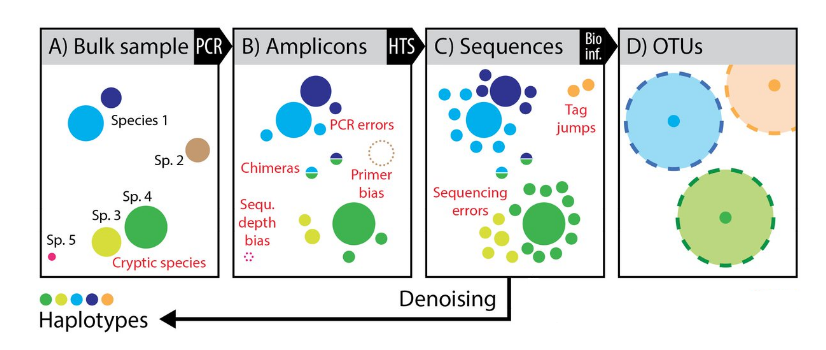
ASV are inferred by a de novo process in which biological sequences are discriminated from errors on the basis of the expectation that biological sequences are more likely to be repeatedly observed than are error-containing sequences
ASV resolution
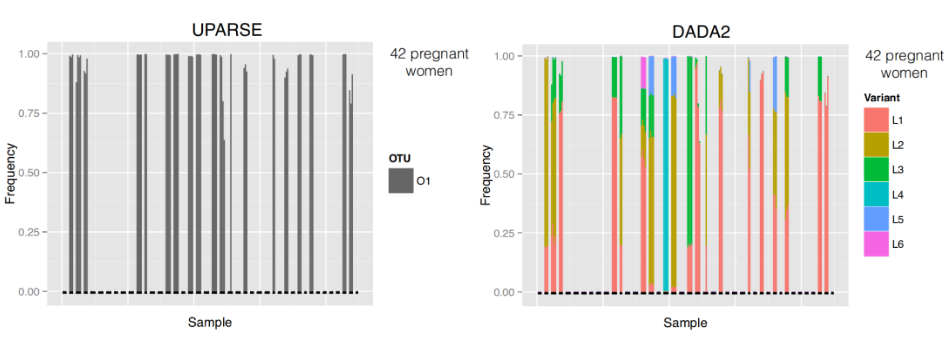
- ASV resolution changes the composition for these samples
Why Swarm?
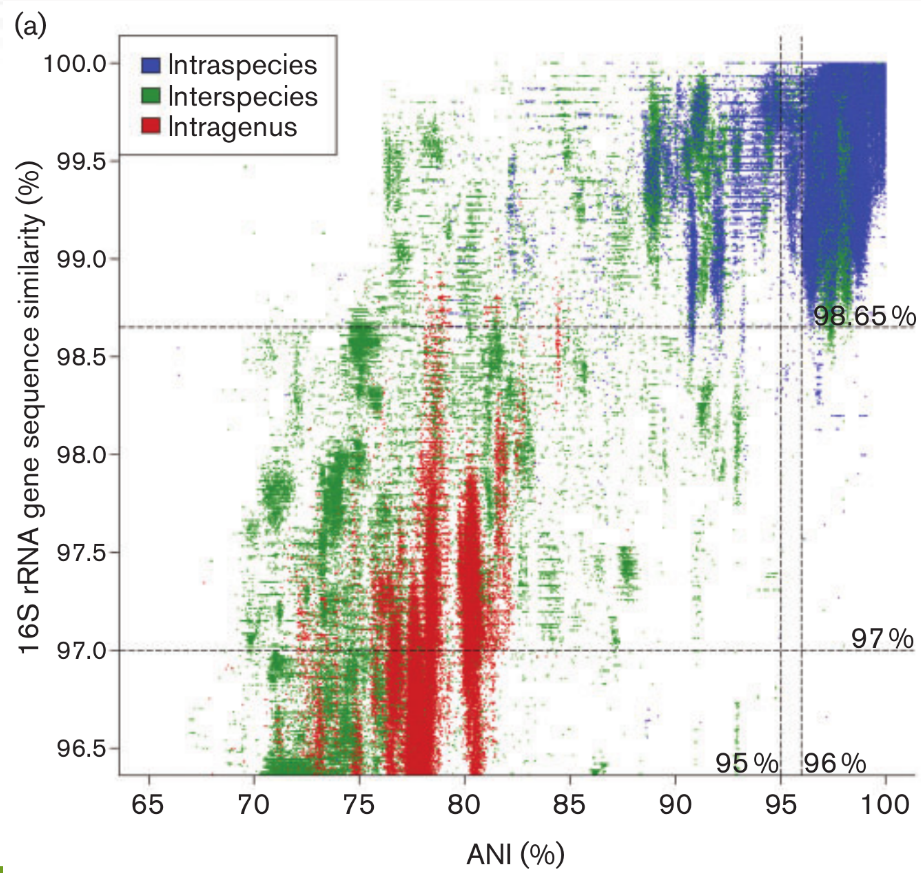
- Fixed clustering threshold is a real problem
- OTUs construction is input-order depenent
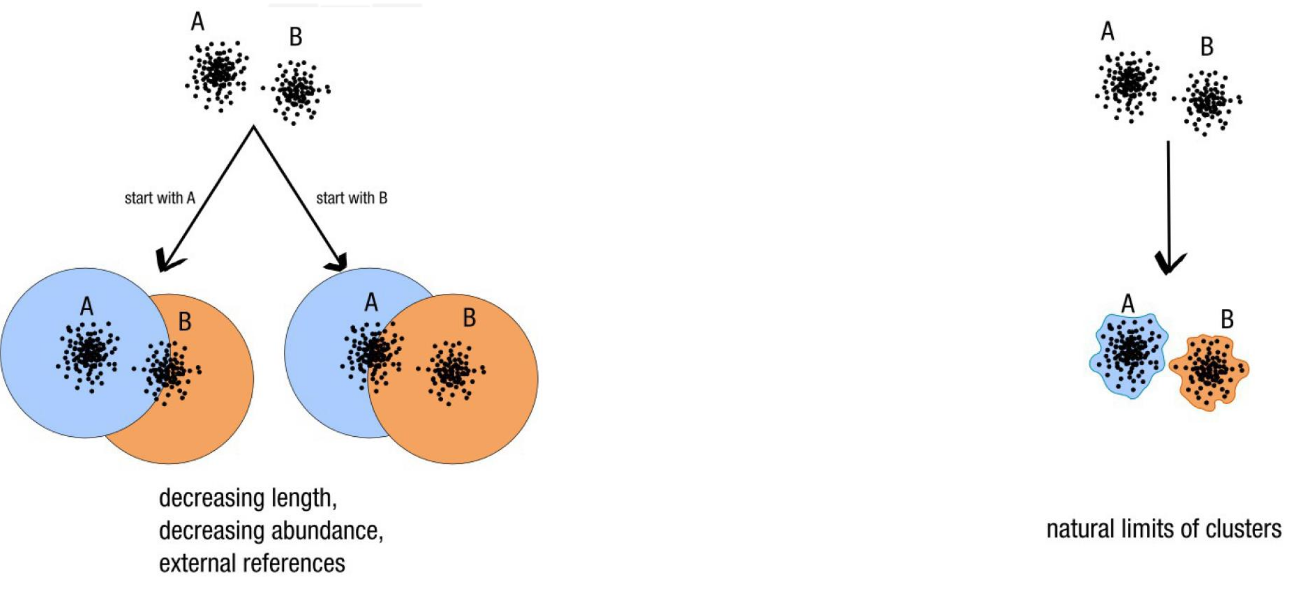
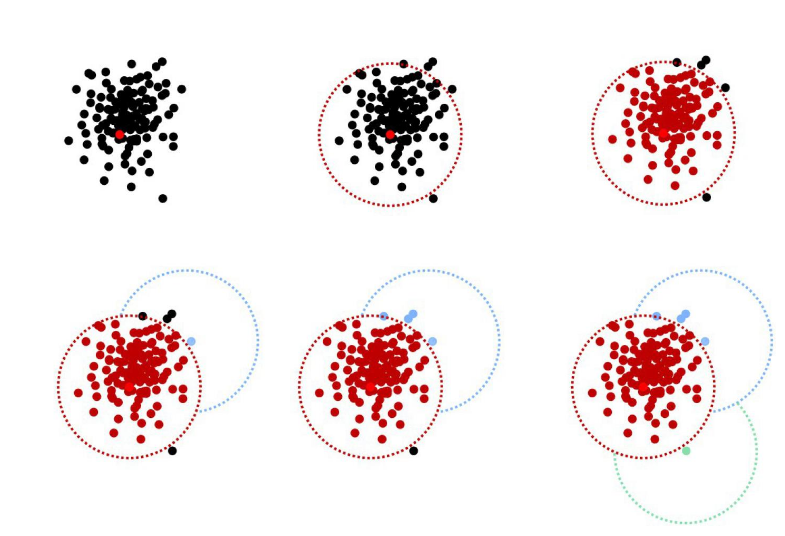
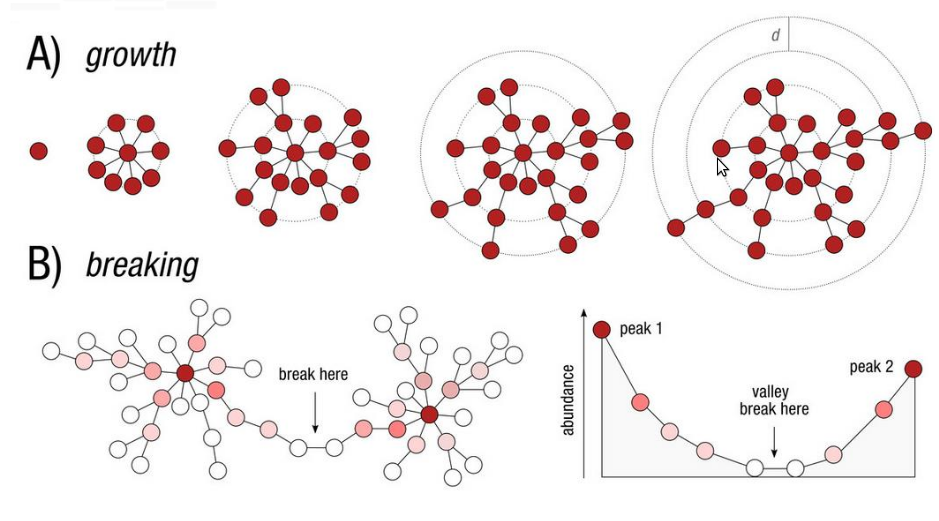
Swarm: A smart idea
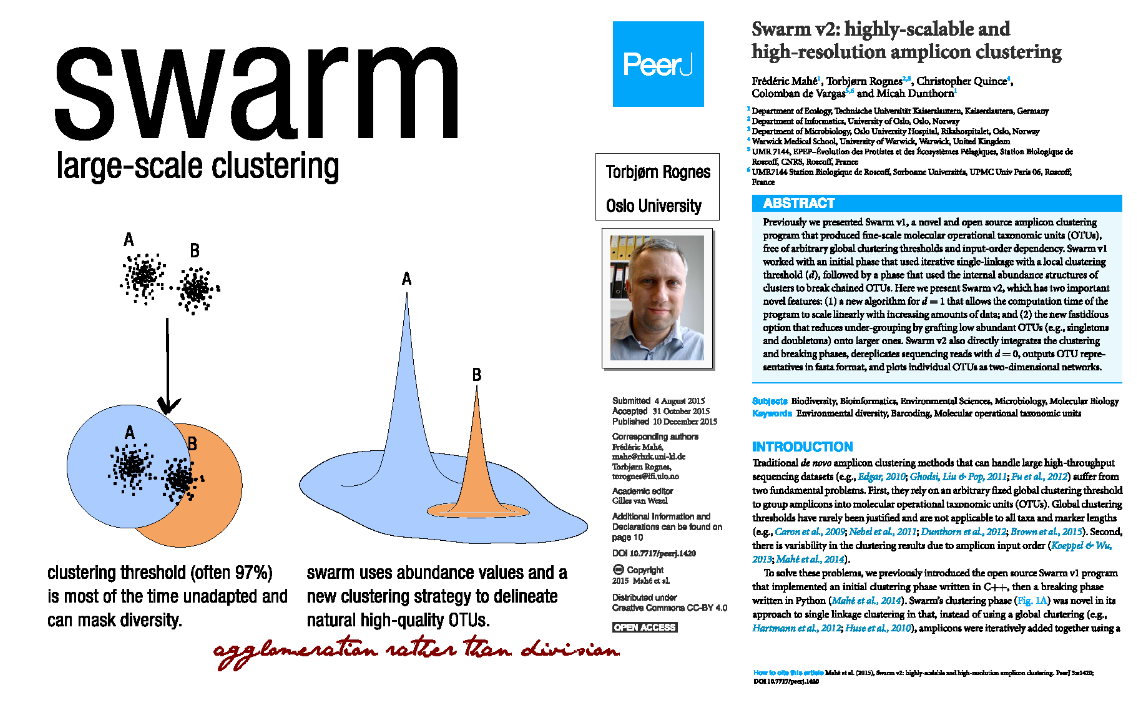
d: the small local linking threshold
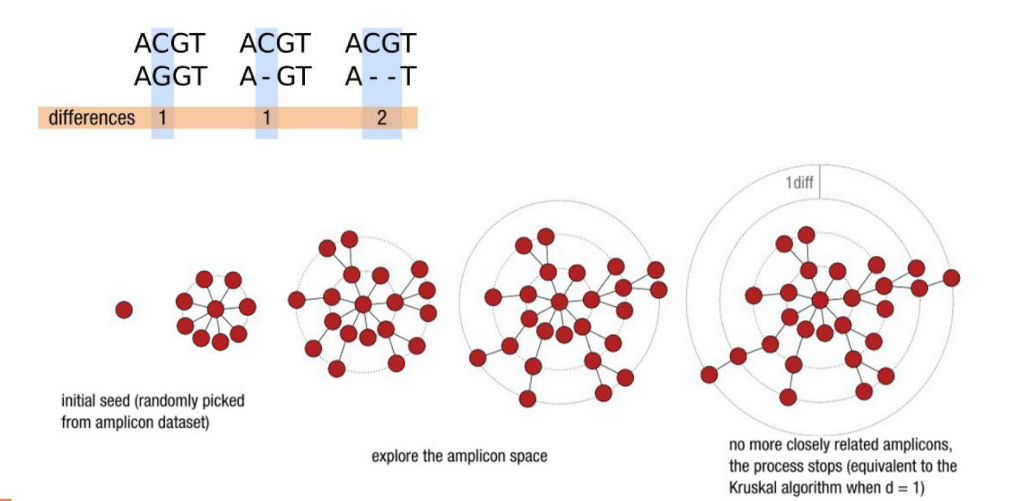
Swarm steps
Which method to choose?
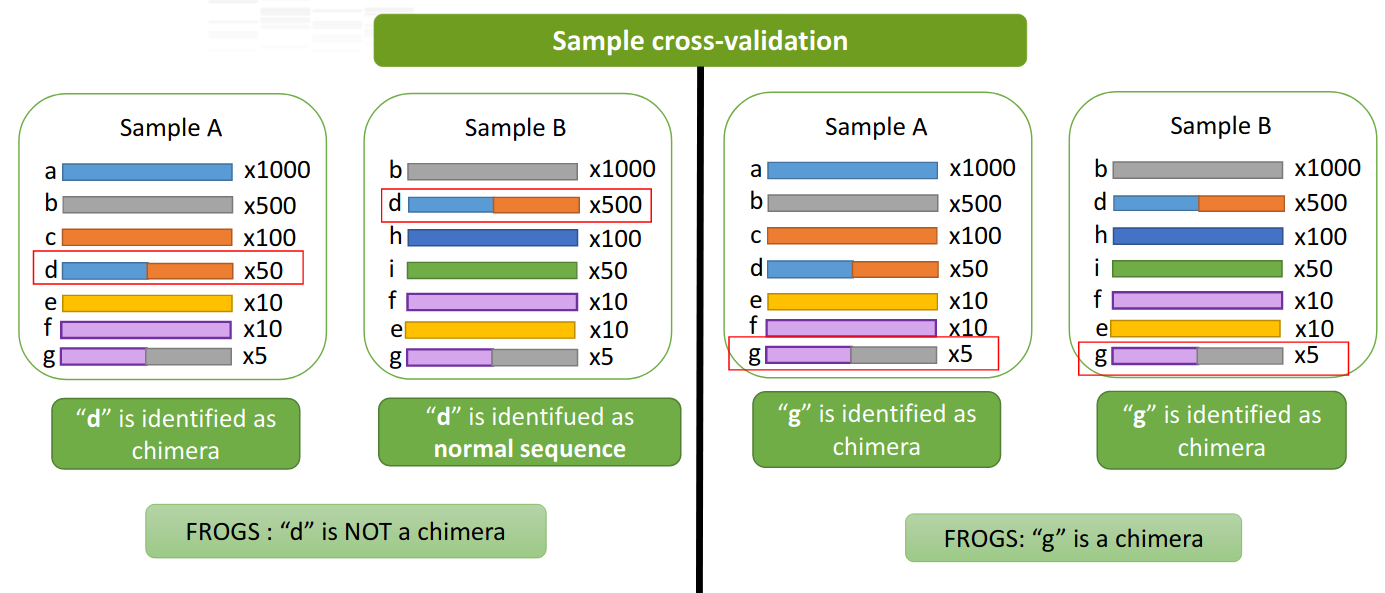
Chimera removal
A little extra: the sample-cross validation
- FROGS adds a sample-cross validation
Chimera rates in samples
- From 5 to 40% in 16S data
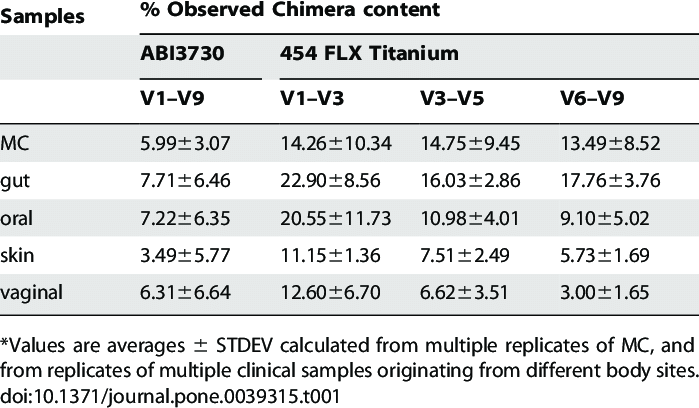
- Few with ITS (<10%)
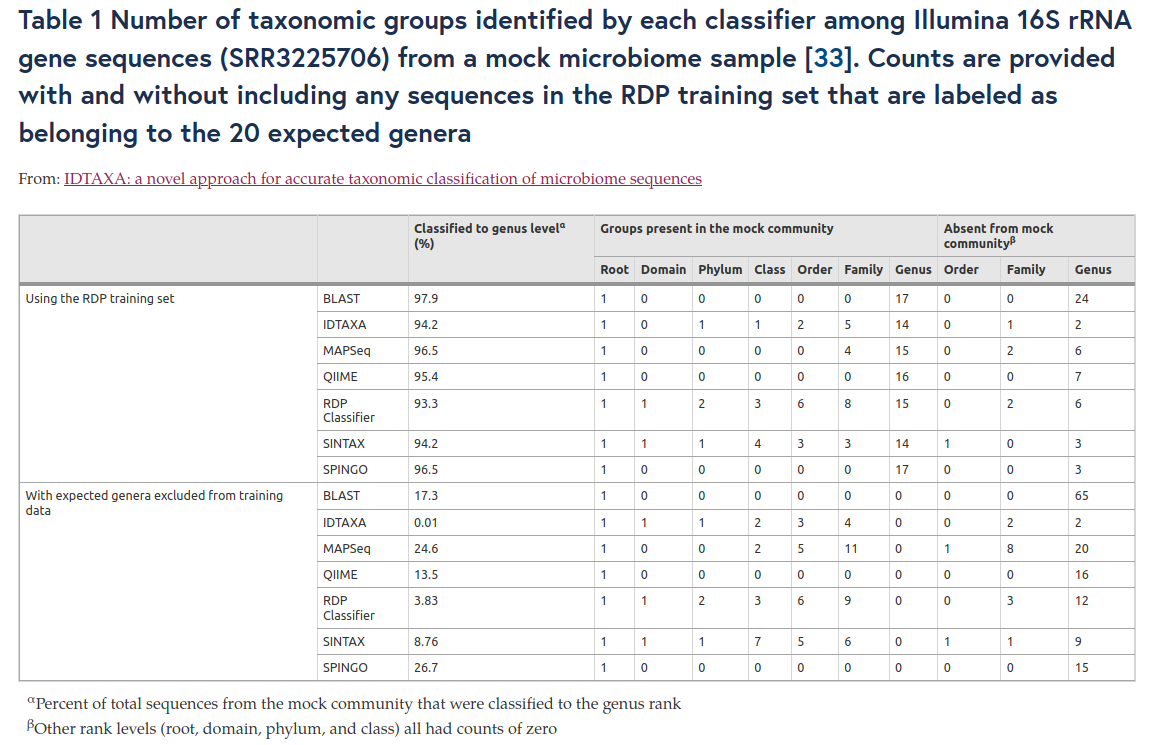
Comparison of approaches
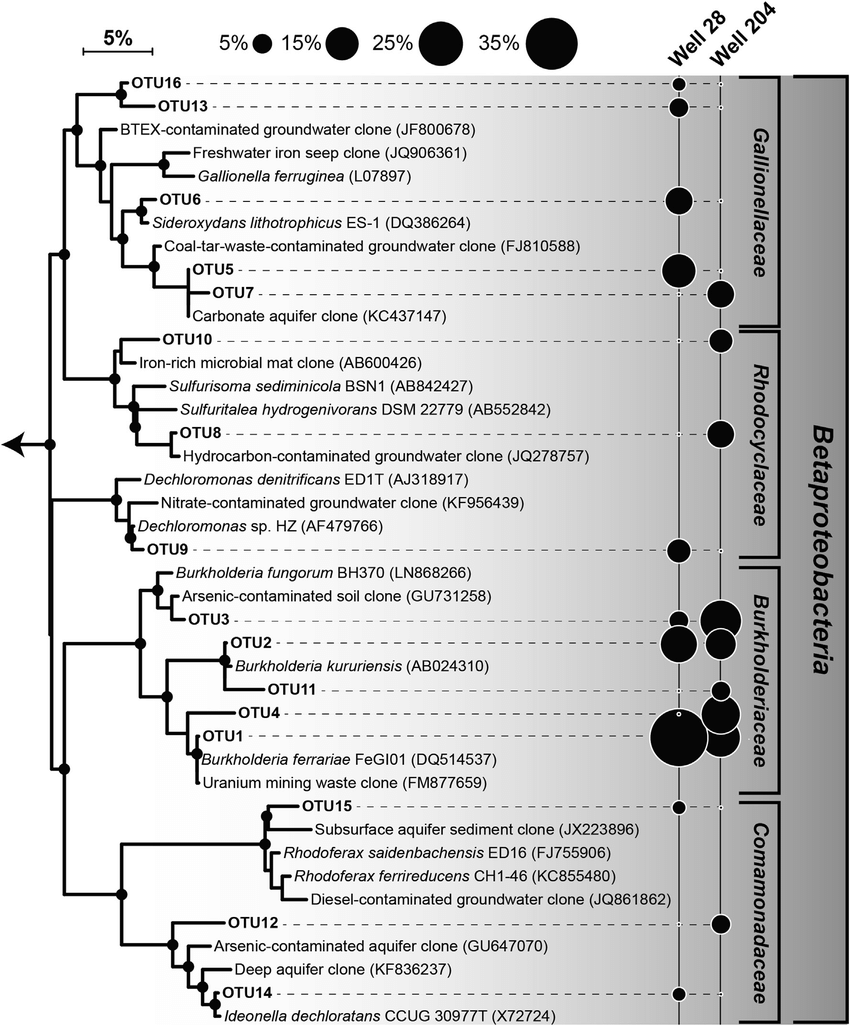
FROGS tree
- This tool builds a phylogenetic tree thanks to affiliations of ASVs contained in the BIOM file
- Needed to compute beta-diversity indices based on phylogenetic distances
- Interesting to explore poor-characterized environments
Concepts
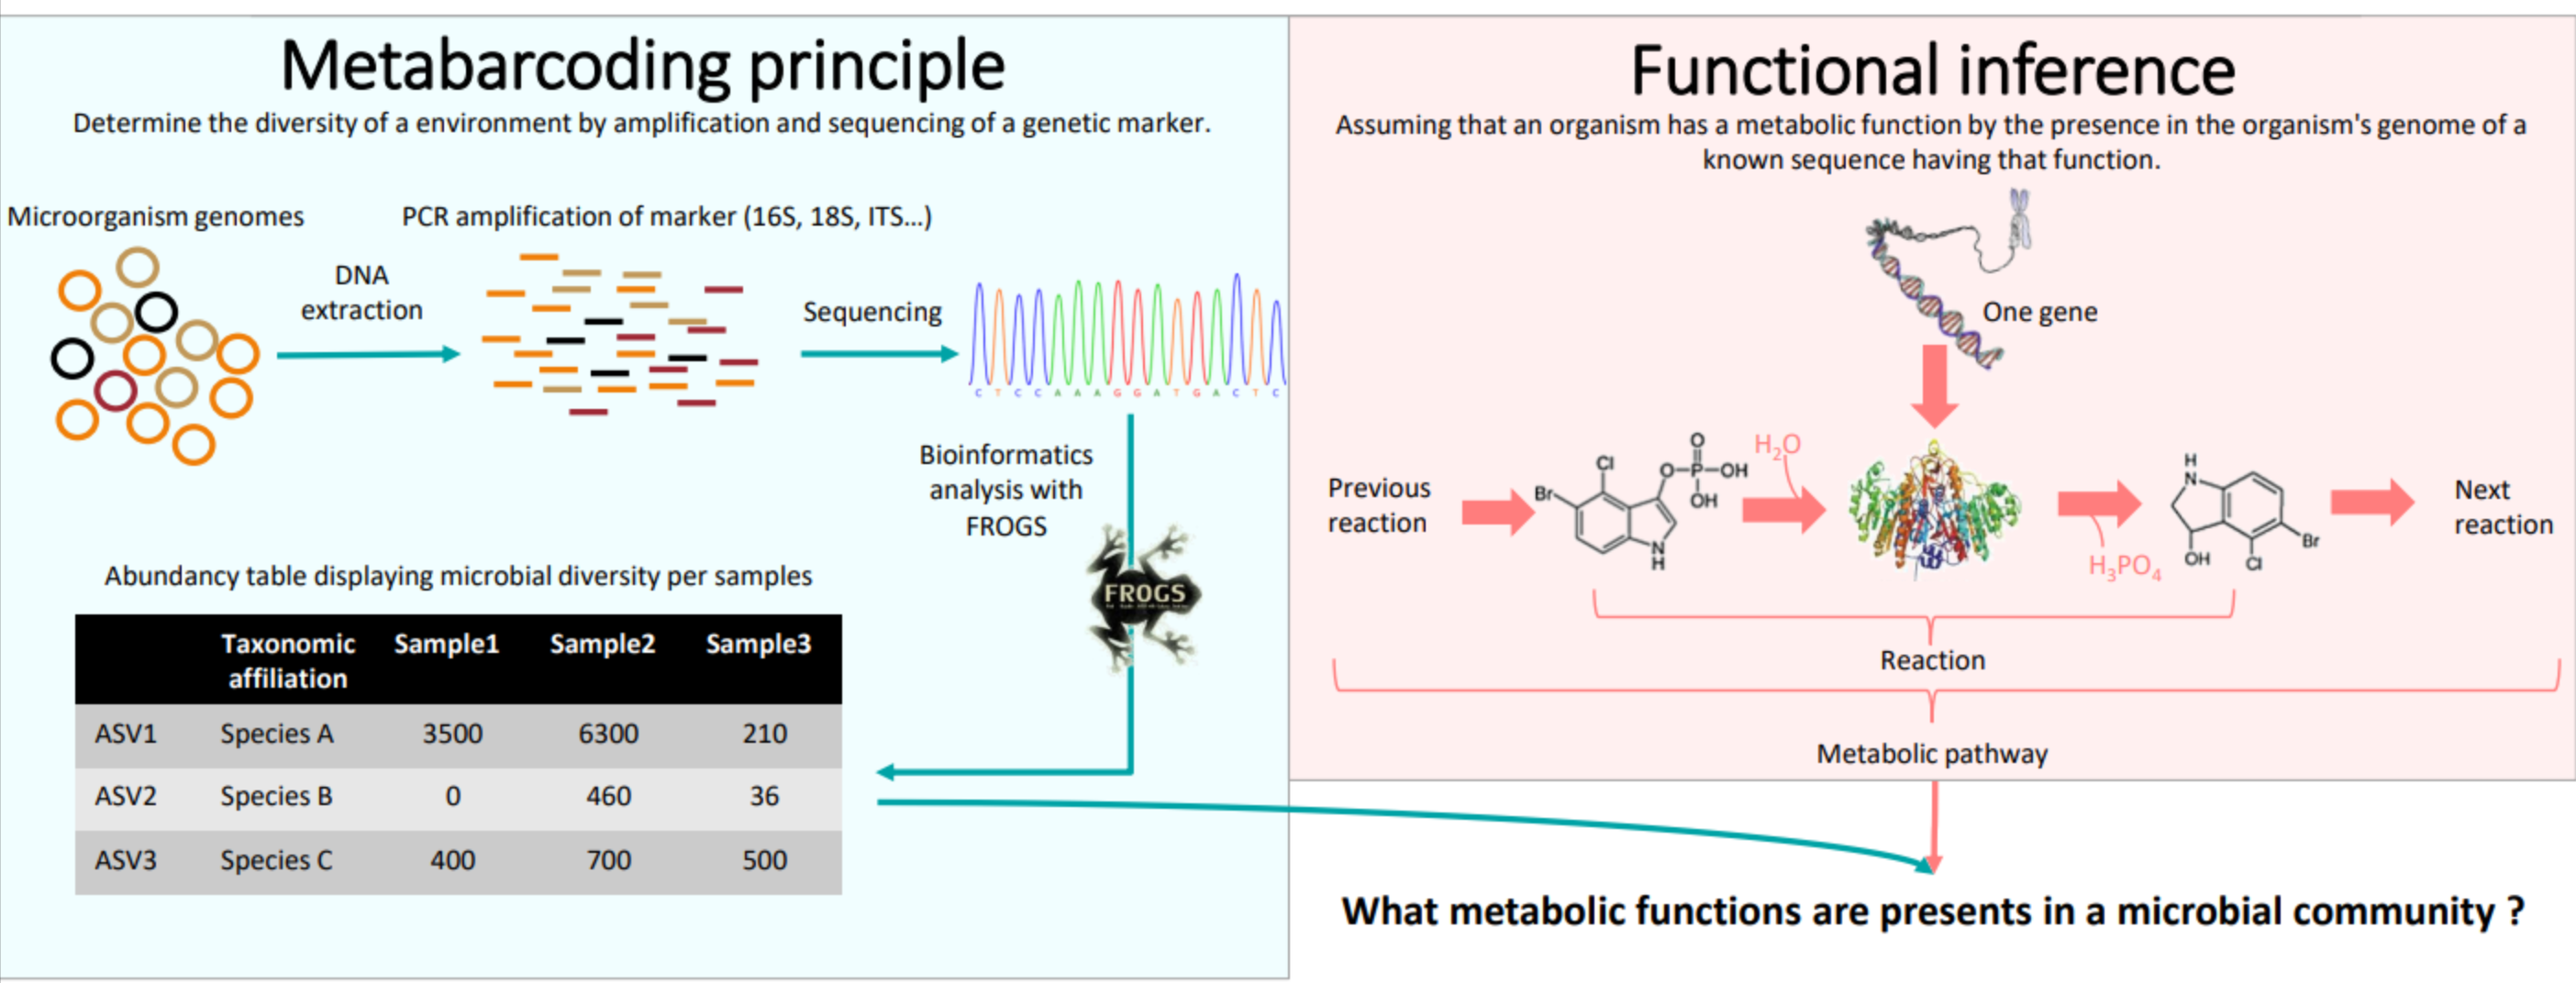
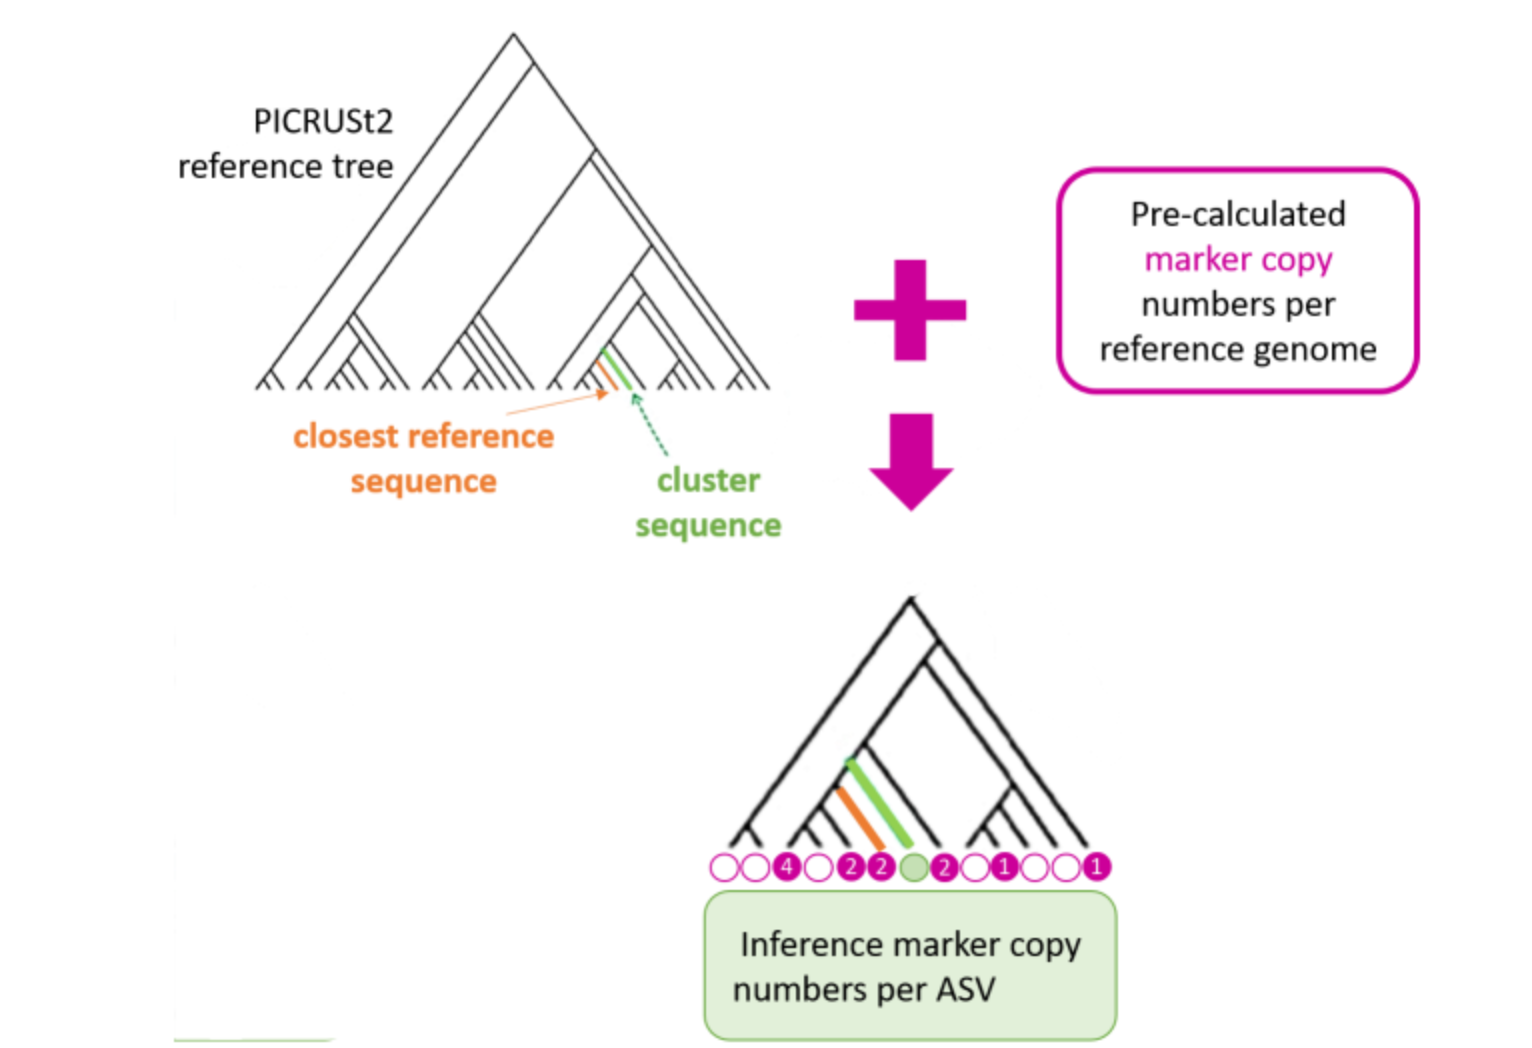
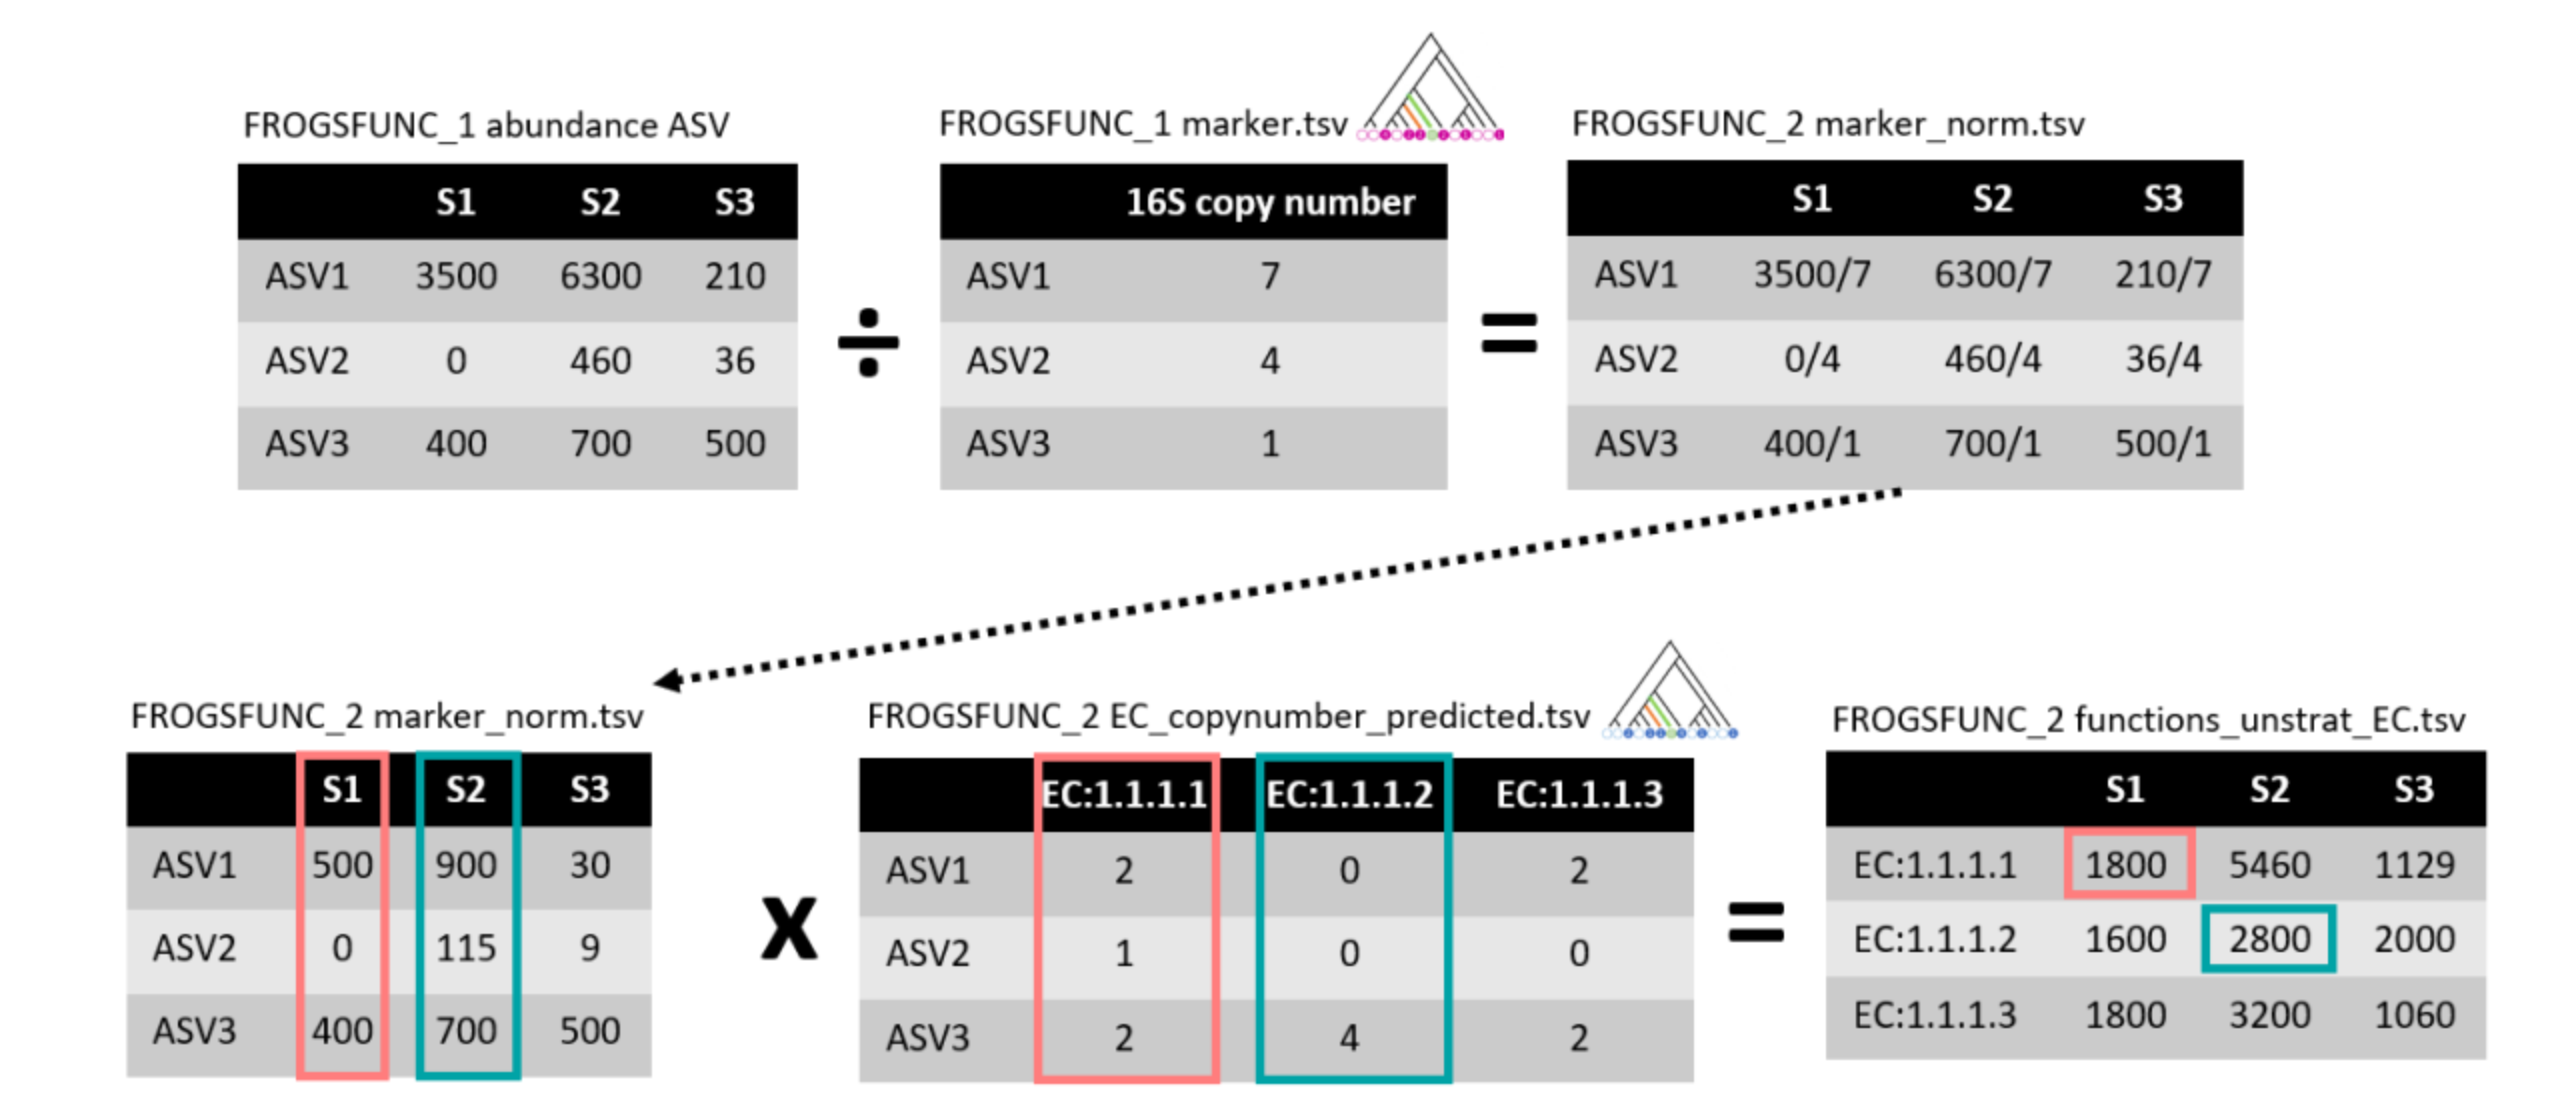
FROGSfunc placeseqs and copynumber
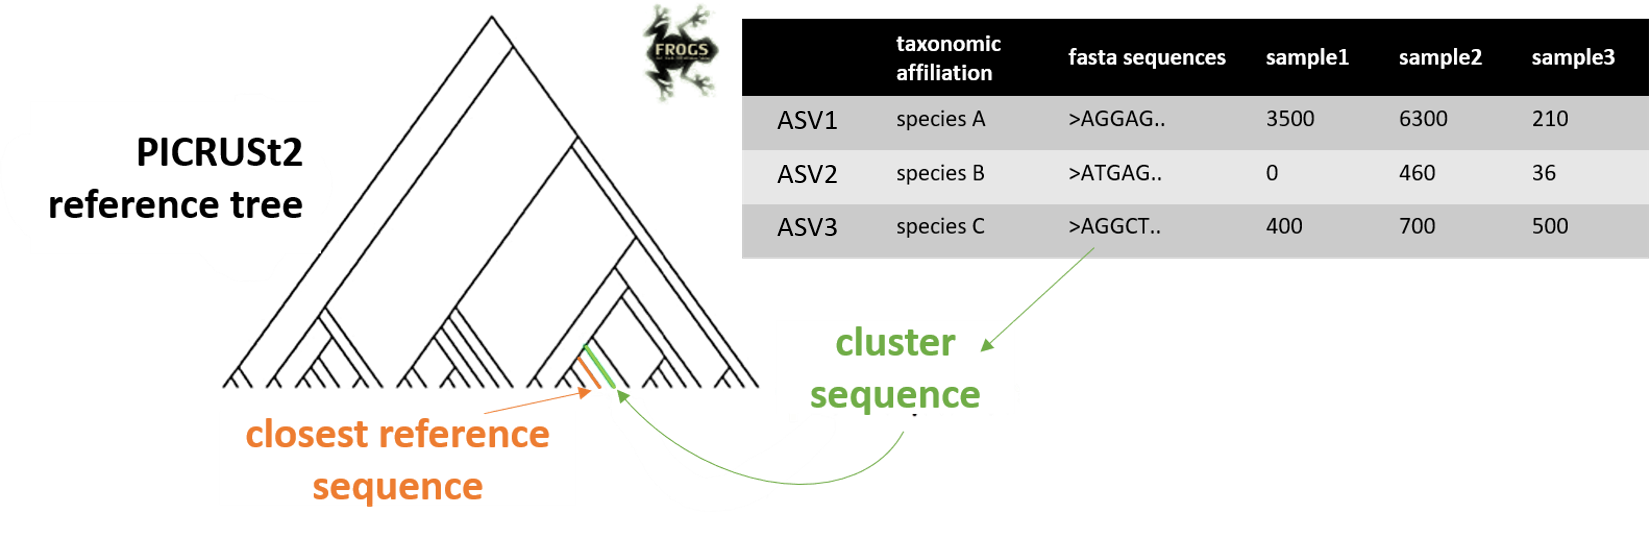
FROGSfunc placeseqs and copynumber
FROGSfunc functions
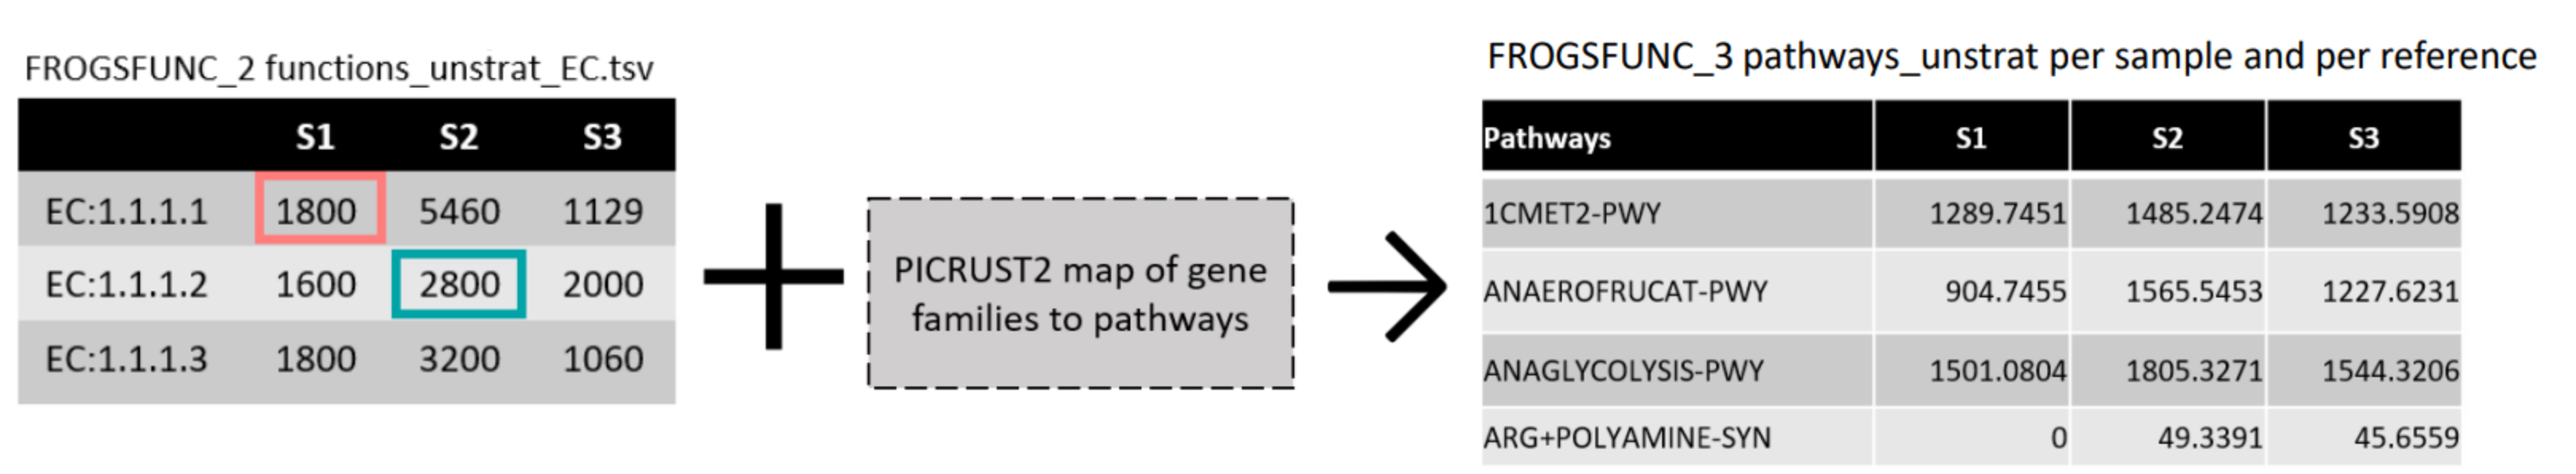
FROGSfunc pathways
Thanks for your attention