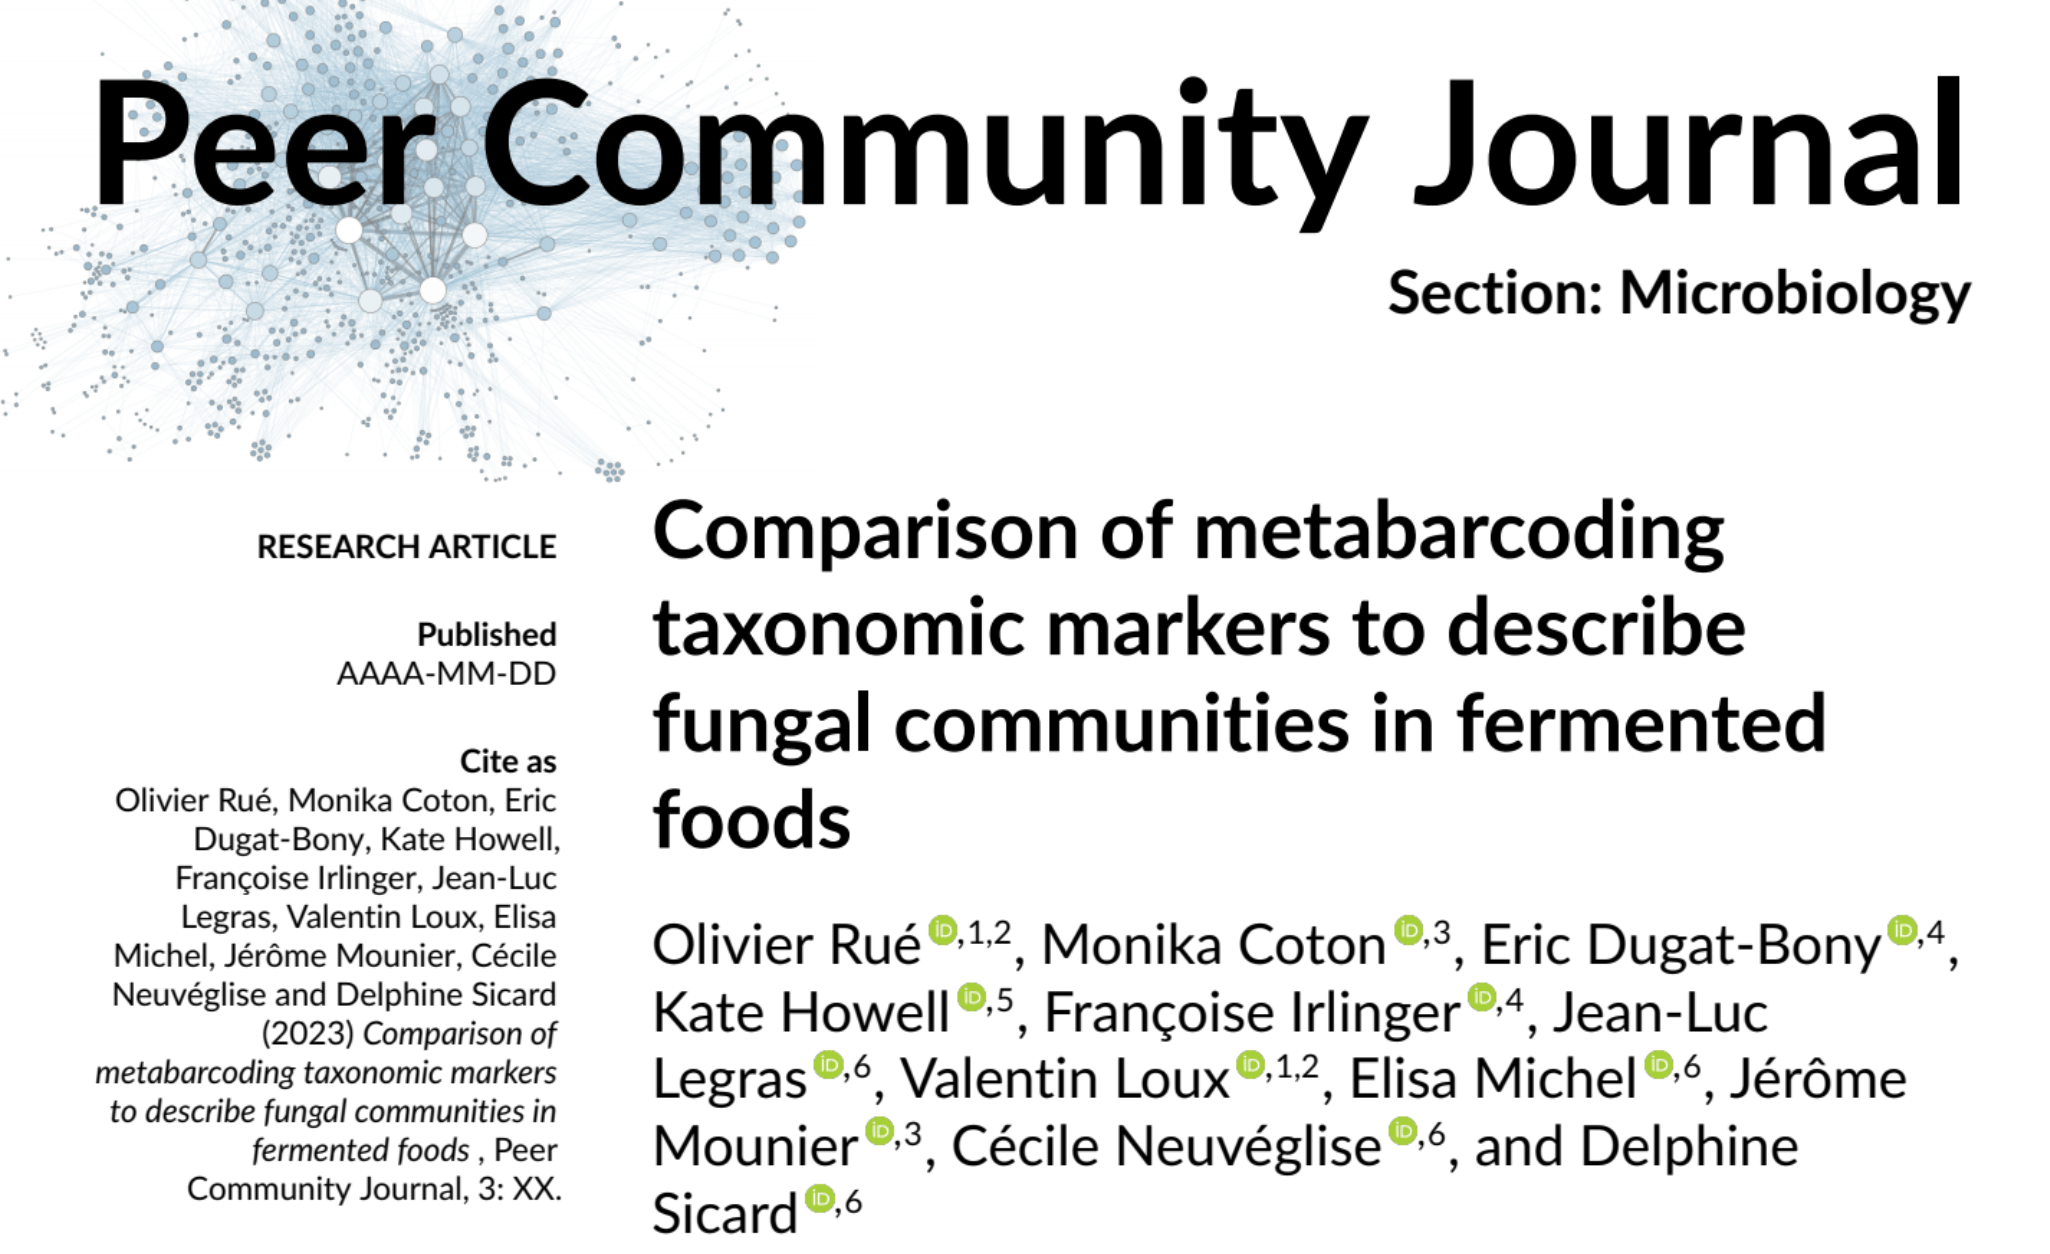
Comparison of metabarcoding taxonomic markers to describe fungal communities in fermented foods
METABARFOOD project
Olivier Rué 
MaIAGE - Migale
December 4, 2023
Meta-omics using next-genertation sequencing (NGS)
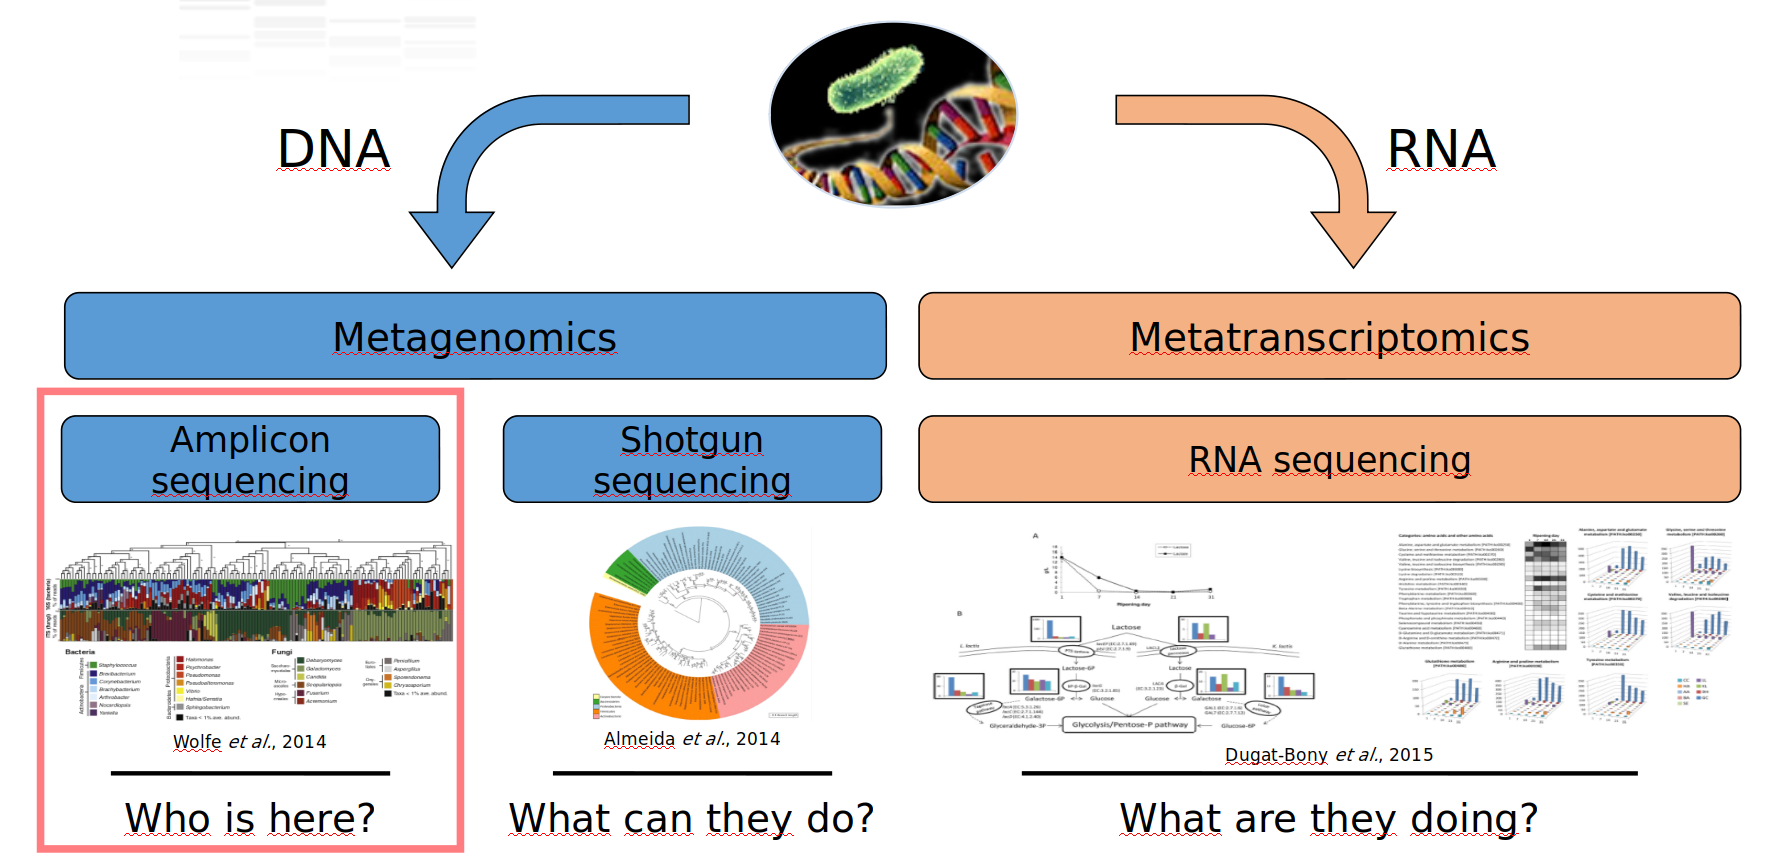
Meta-omics using next-genertation sequencing (NGS)
What is a good marker gene?
- ubiquist, conserved among taxa
- enough divergent to distinguish strains, not submitted to lateral transfer
- only one copy in genome
- has conserved regions to design specific primers
- is enough studied to be present in databanks for taxonomic affiliation
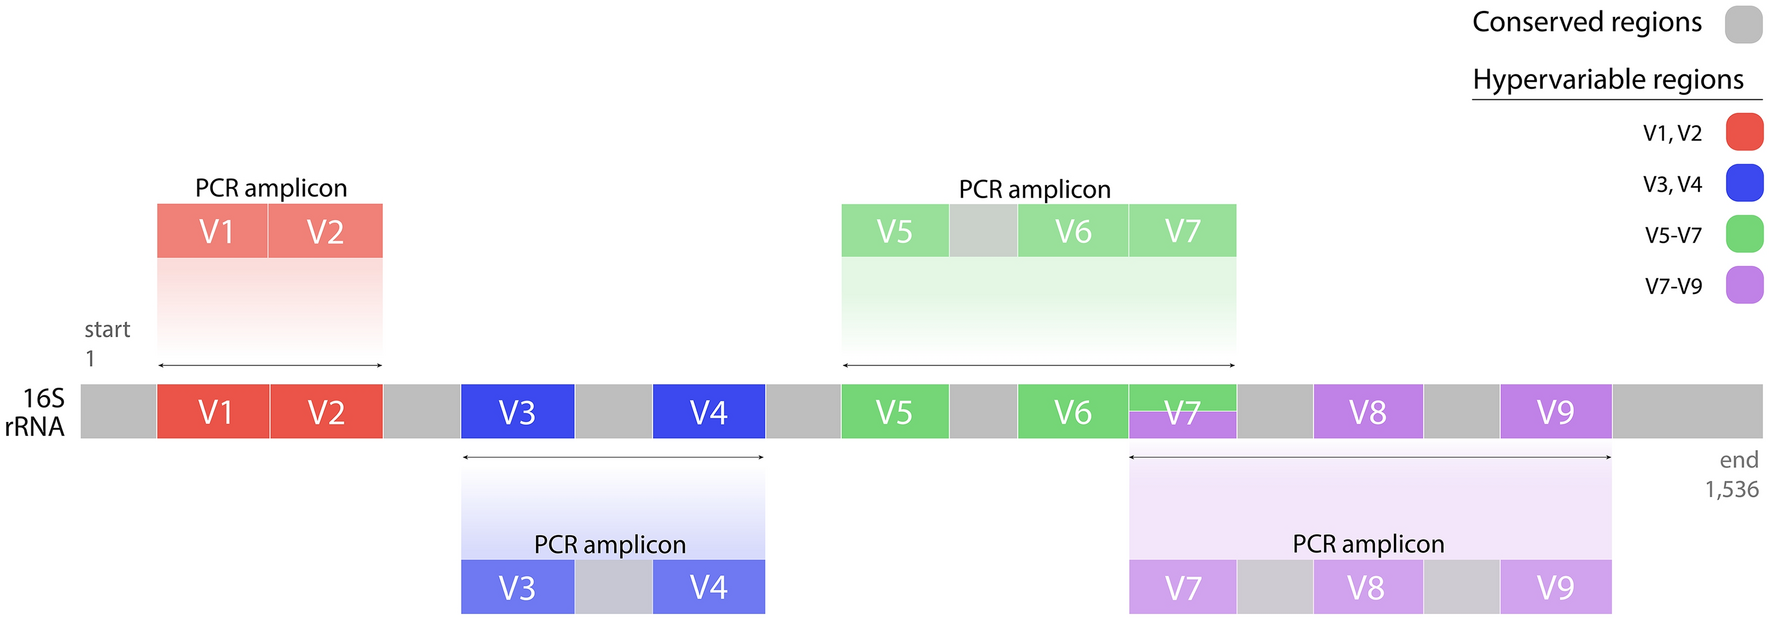
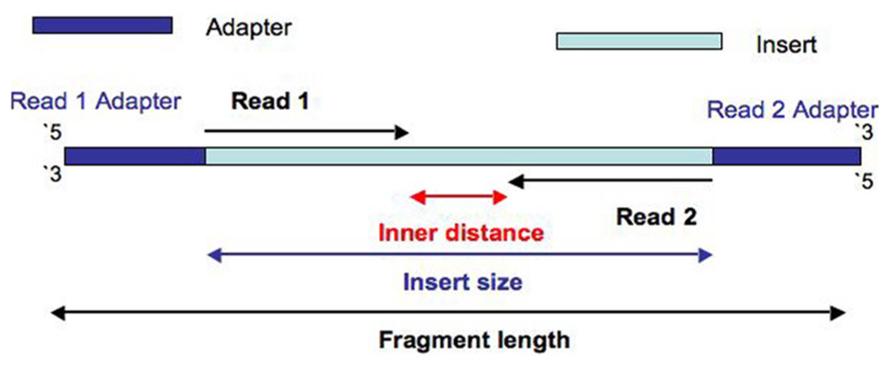
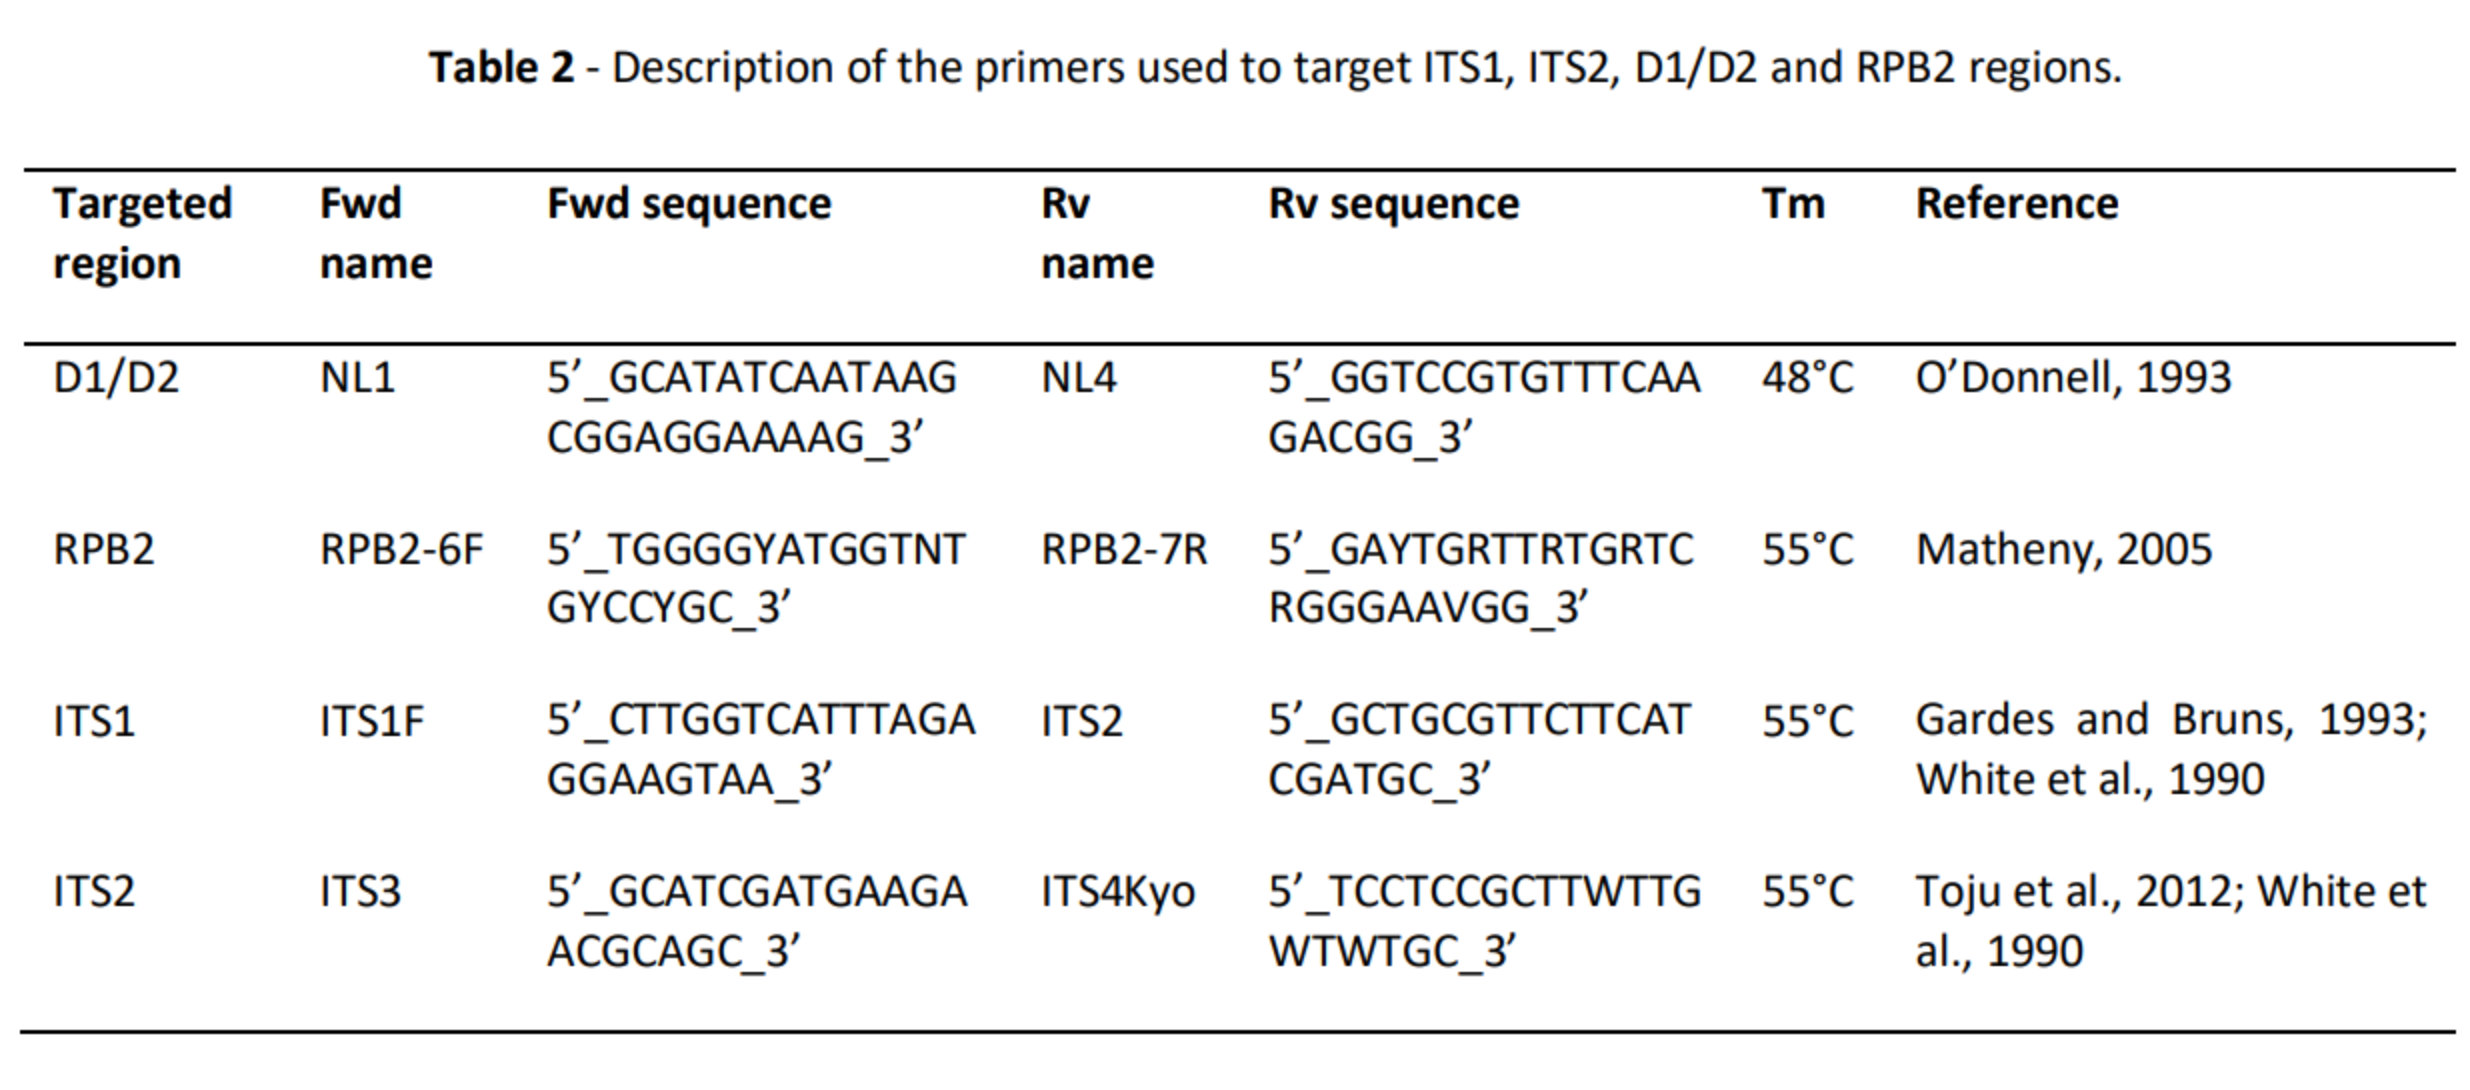
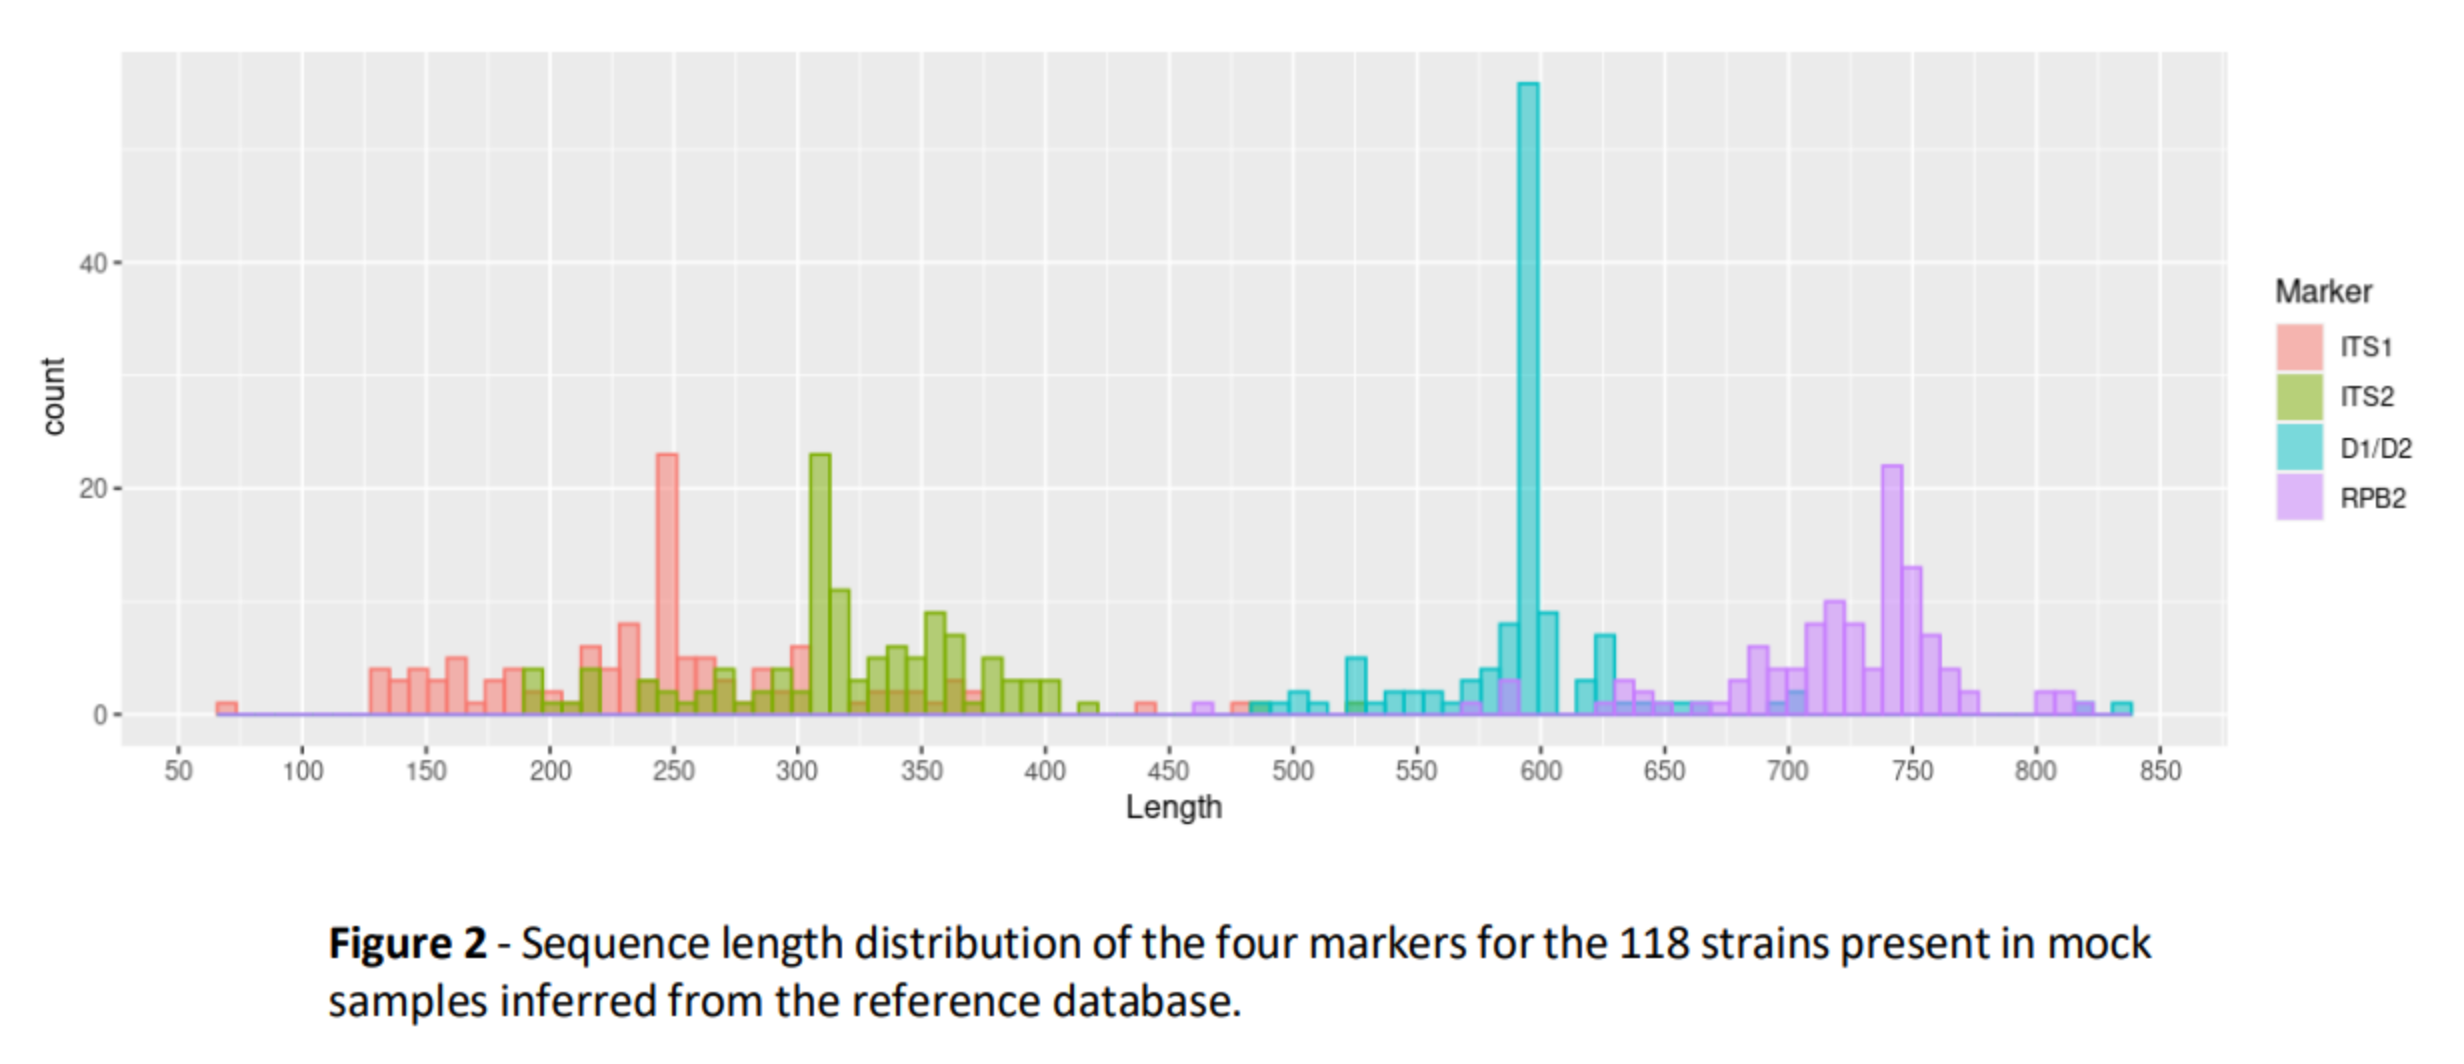
Size and Illumina sequencing
Bioinformatics challenges
- ⚠️ No tool able to deal correctly with sequences of variable sizes → impossible to compare them
- All tools dedicated to 16S data (350-500 nt)
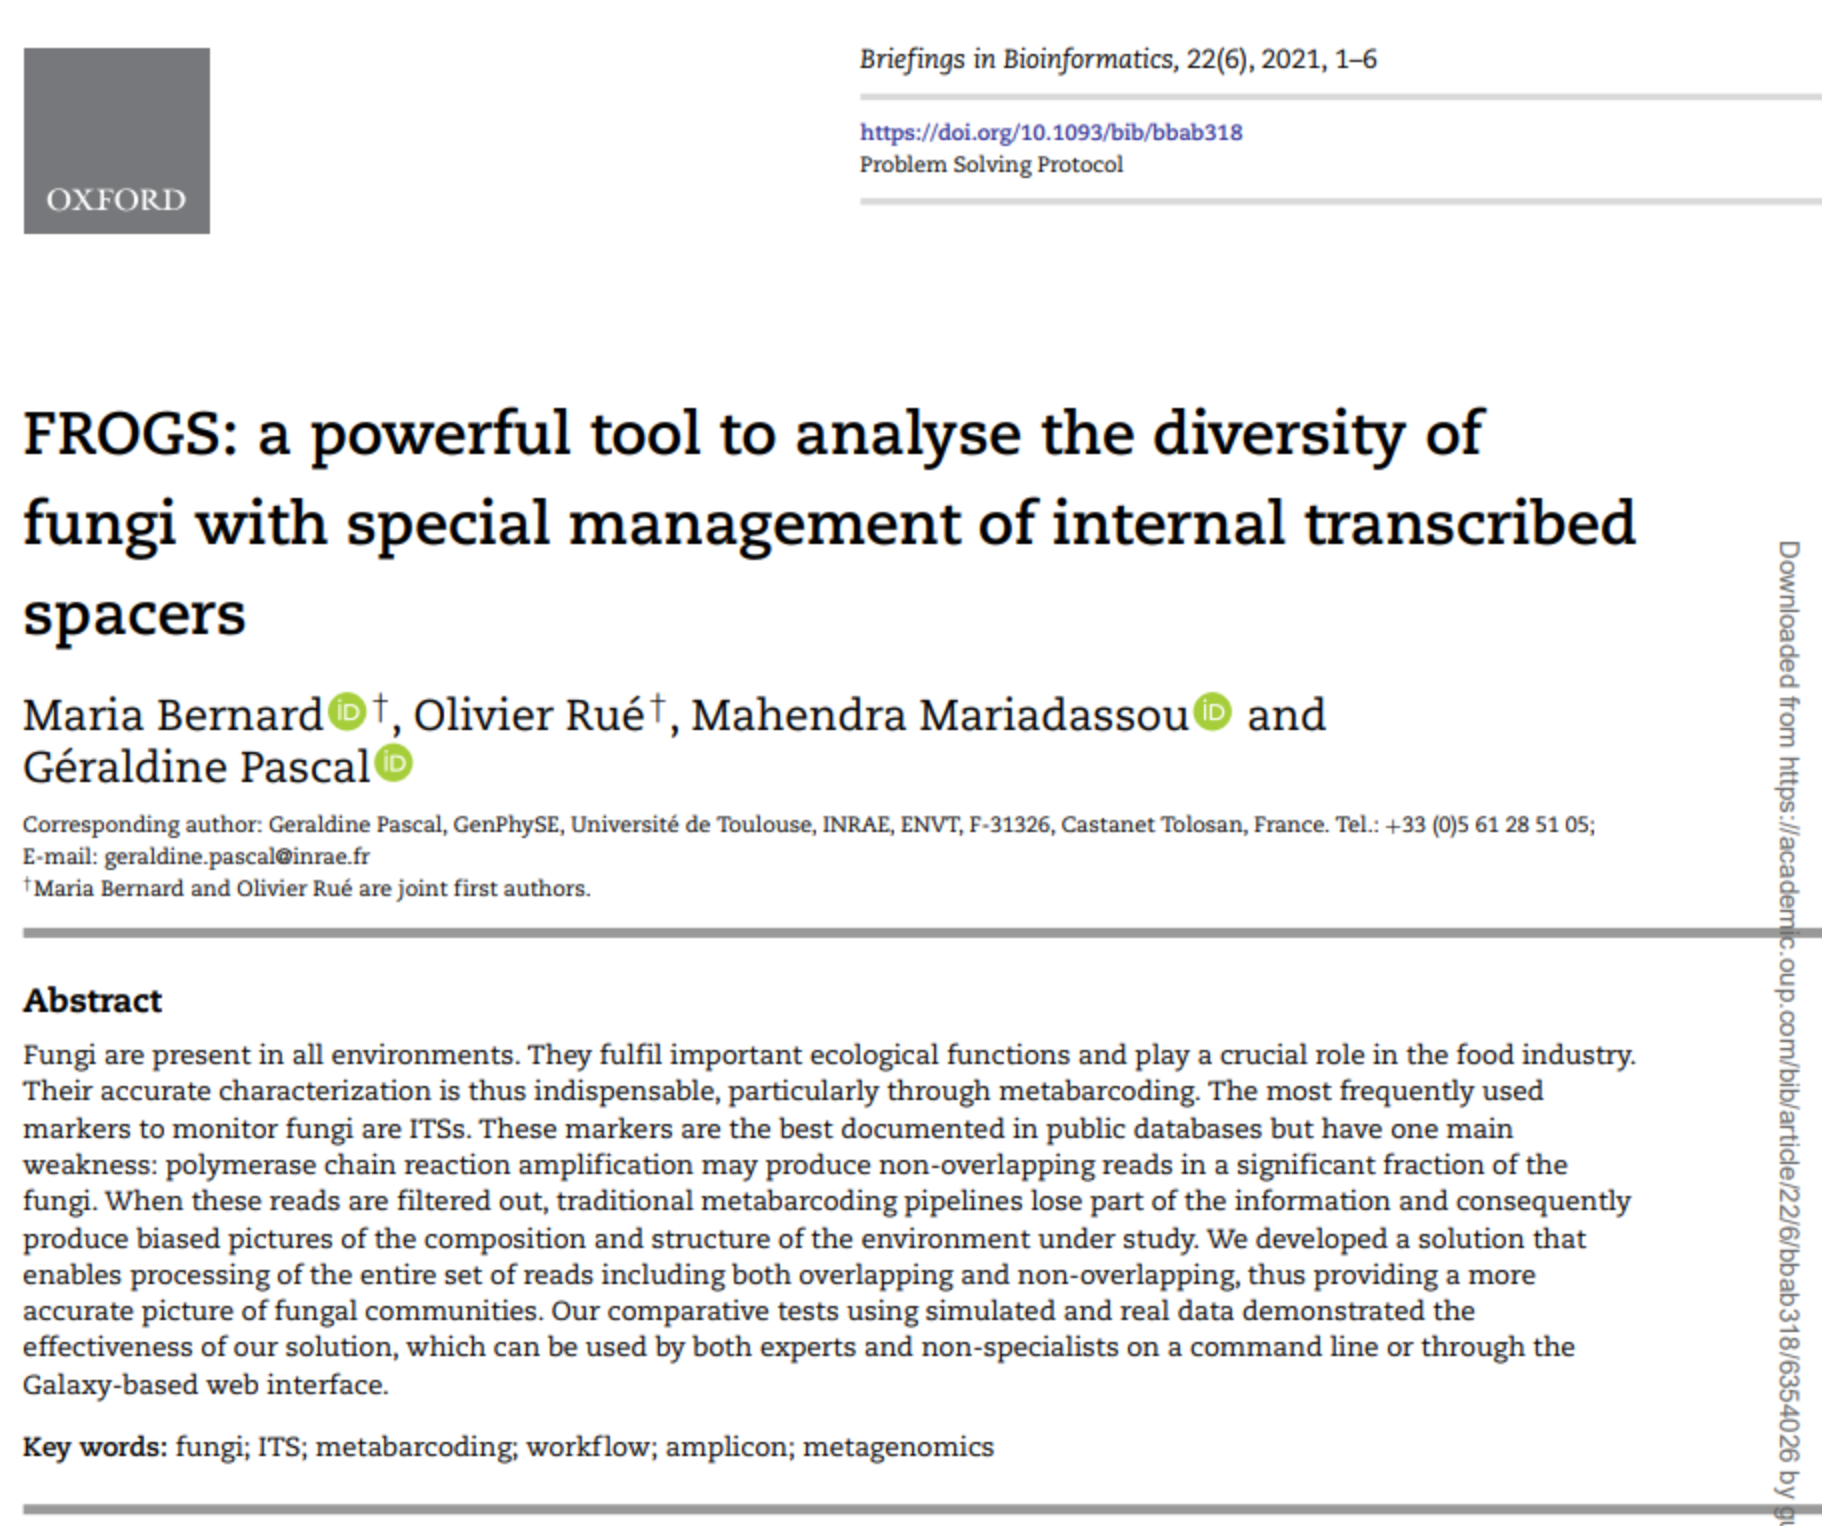
- Adaptation of FROGS [1] to deal with ITS data [2]
![]()
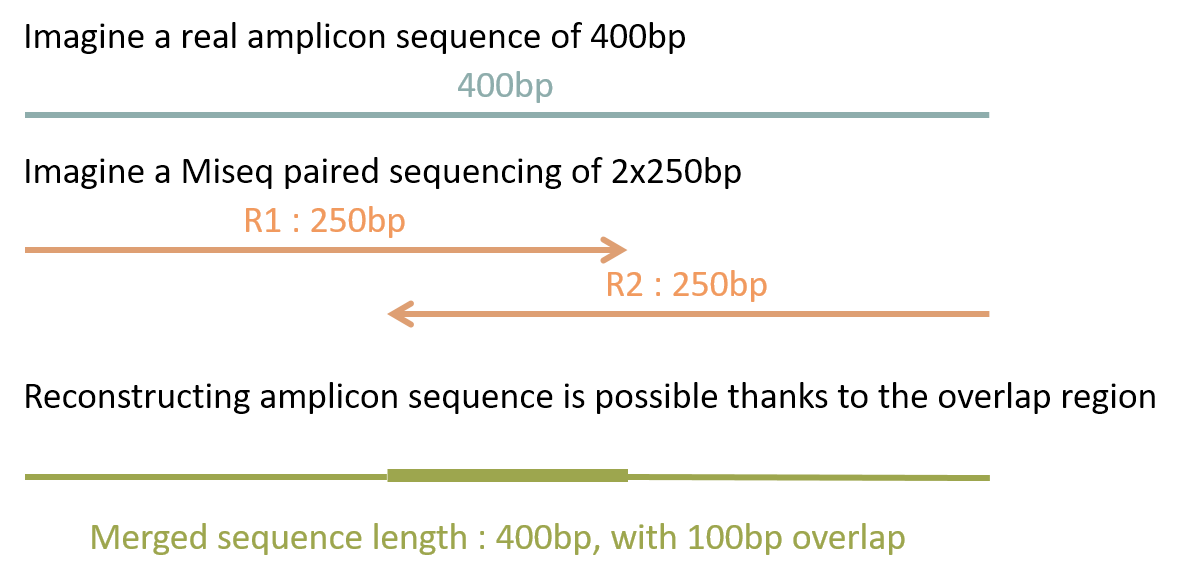
Management of short fragments
| FROGS | Qiime2 | DADA2 | USEARCH | |
|---|---|---|---|---|
| Short | ✅ | ✅ | ✅ | ✅ |
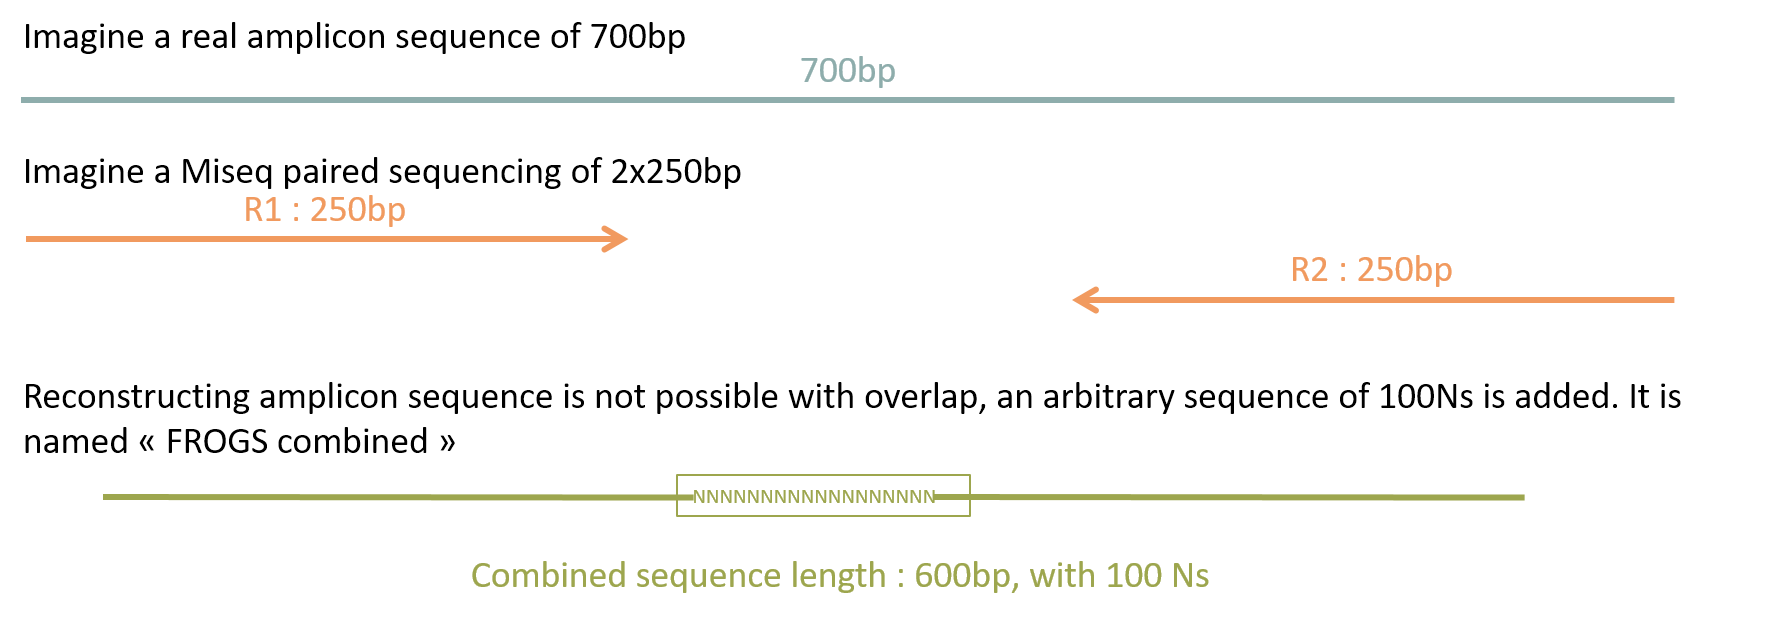
Management of long fragments
| FROGS | Qiime2 | DADA2 | USEARCH | |
|---|---|---|---|---|
| Long | ✅ | ❎ R1 only | ❎ R1 only | ❎ R1 only |
Management of mixed fragments
| FROGS | Qiime2 | DADA2 | USEARCH | |
|---|---|---|---|---|
| Mixed | ✅ | ❎ R1 or only short | ❎ R1 or only short | ❎ R1 and only short |
Clustering or denoising?
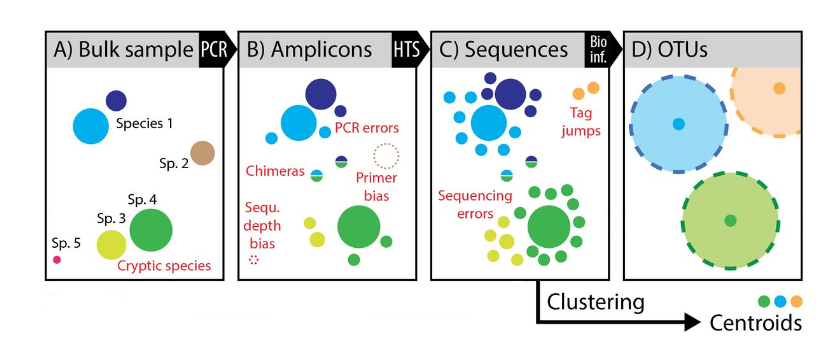
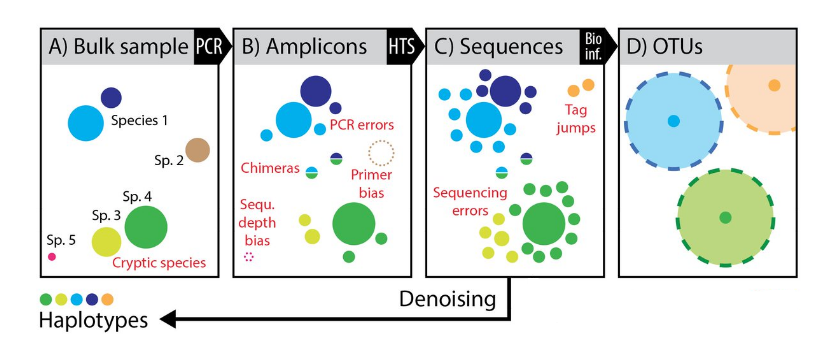
Densoising power
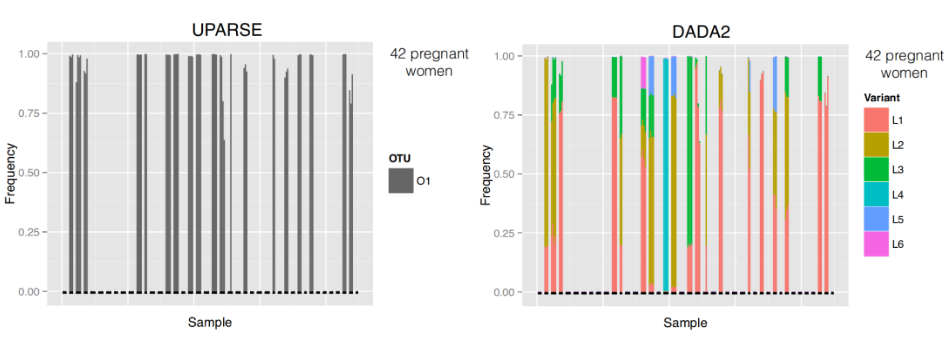
- Variants are aggregated in a single OTU
- Conclusions are not the same
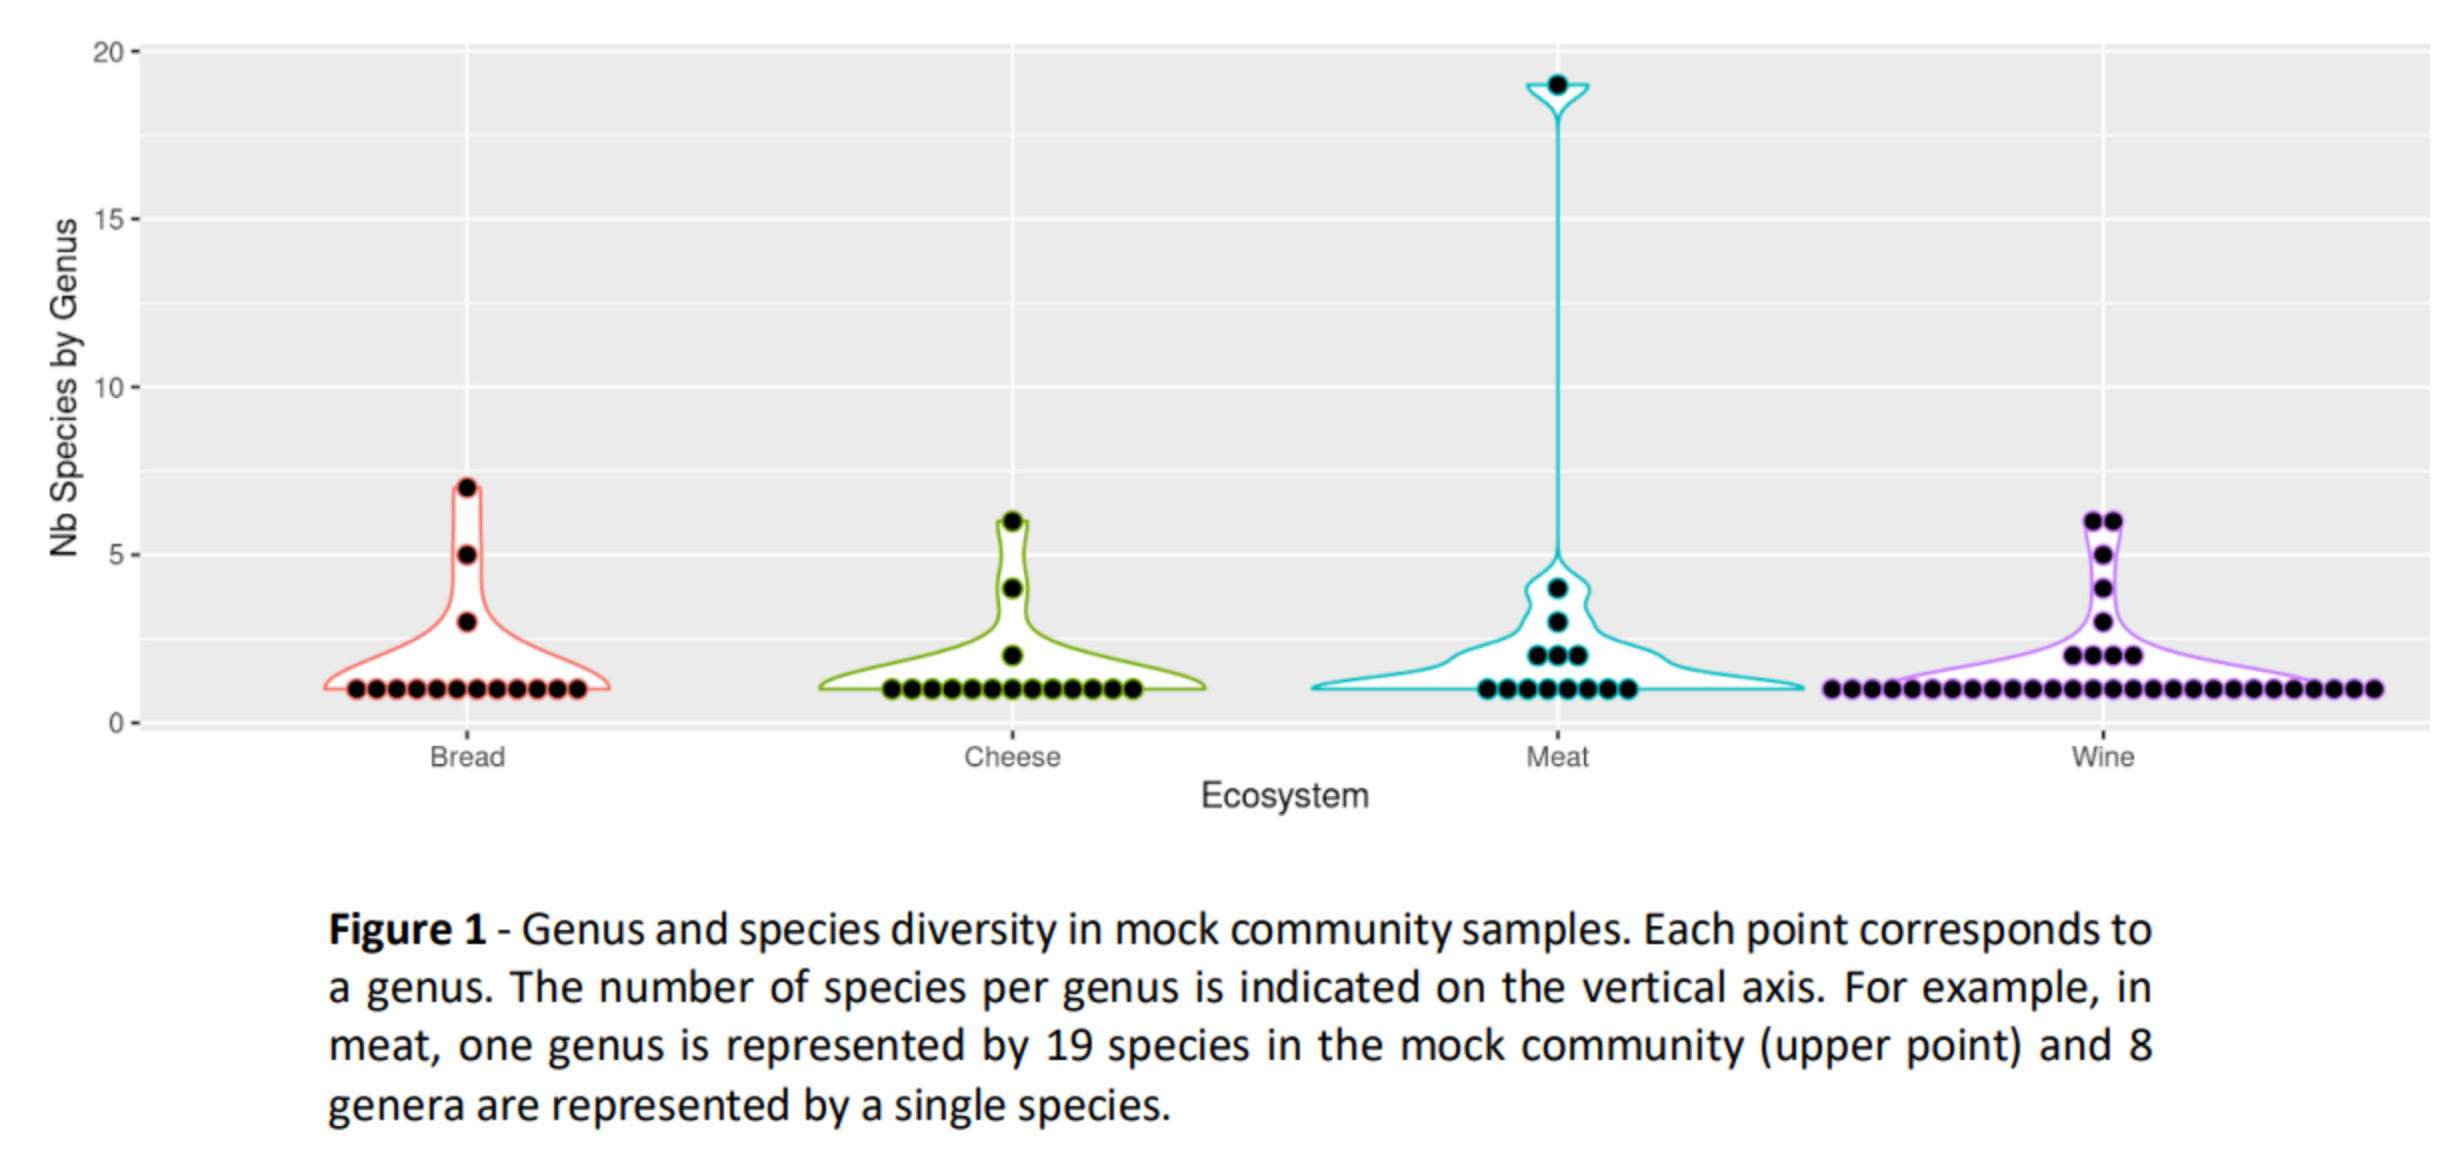
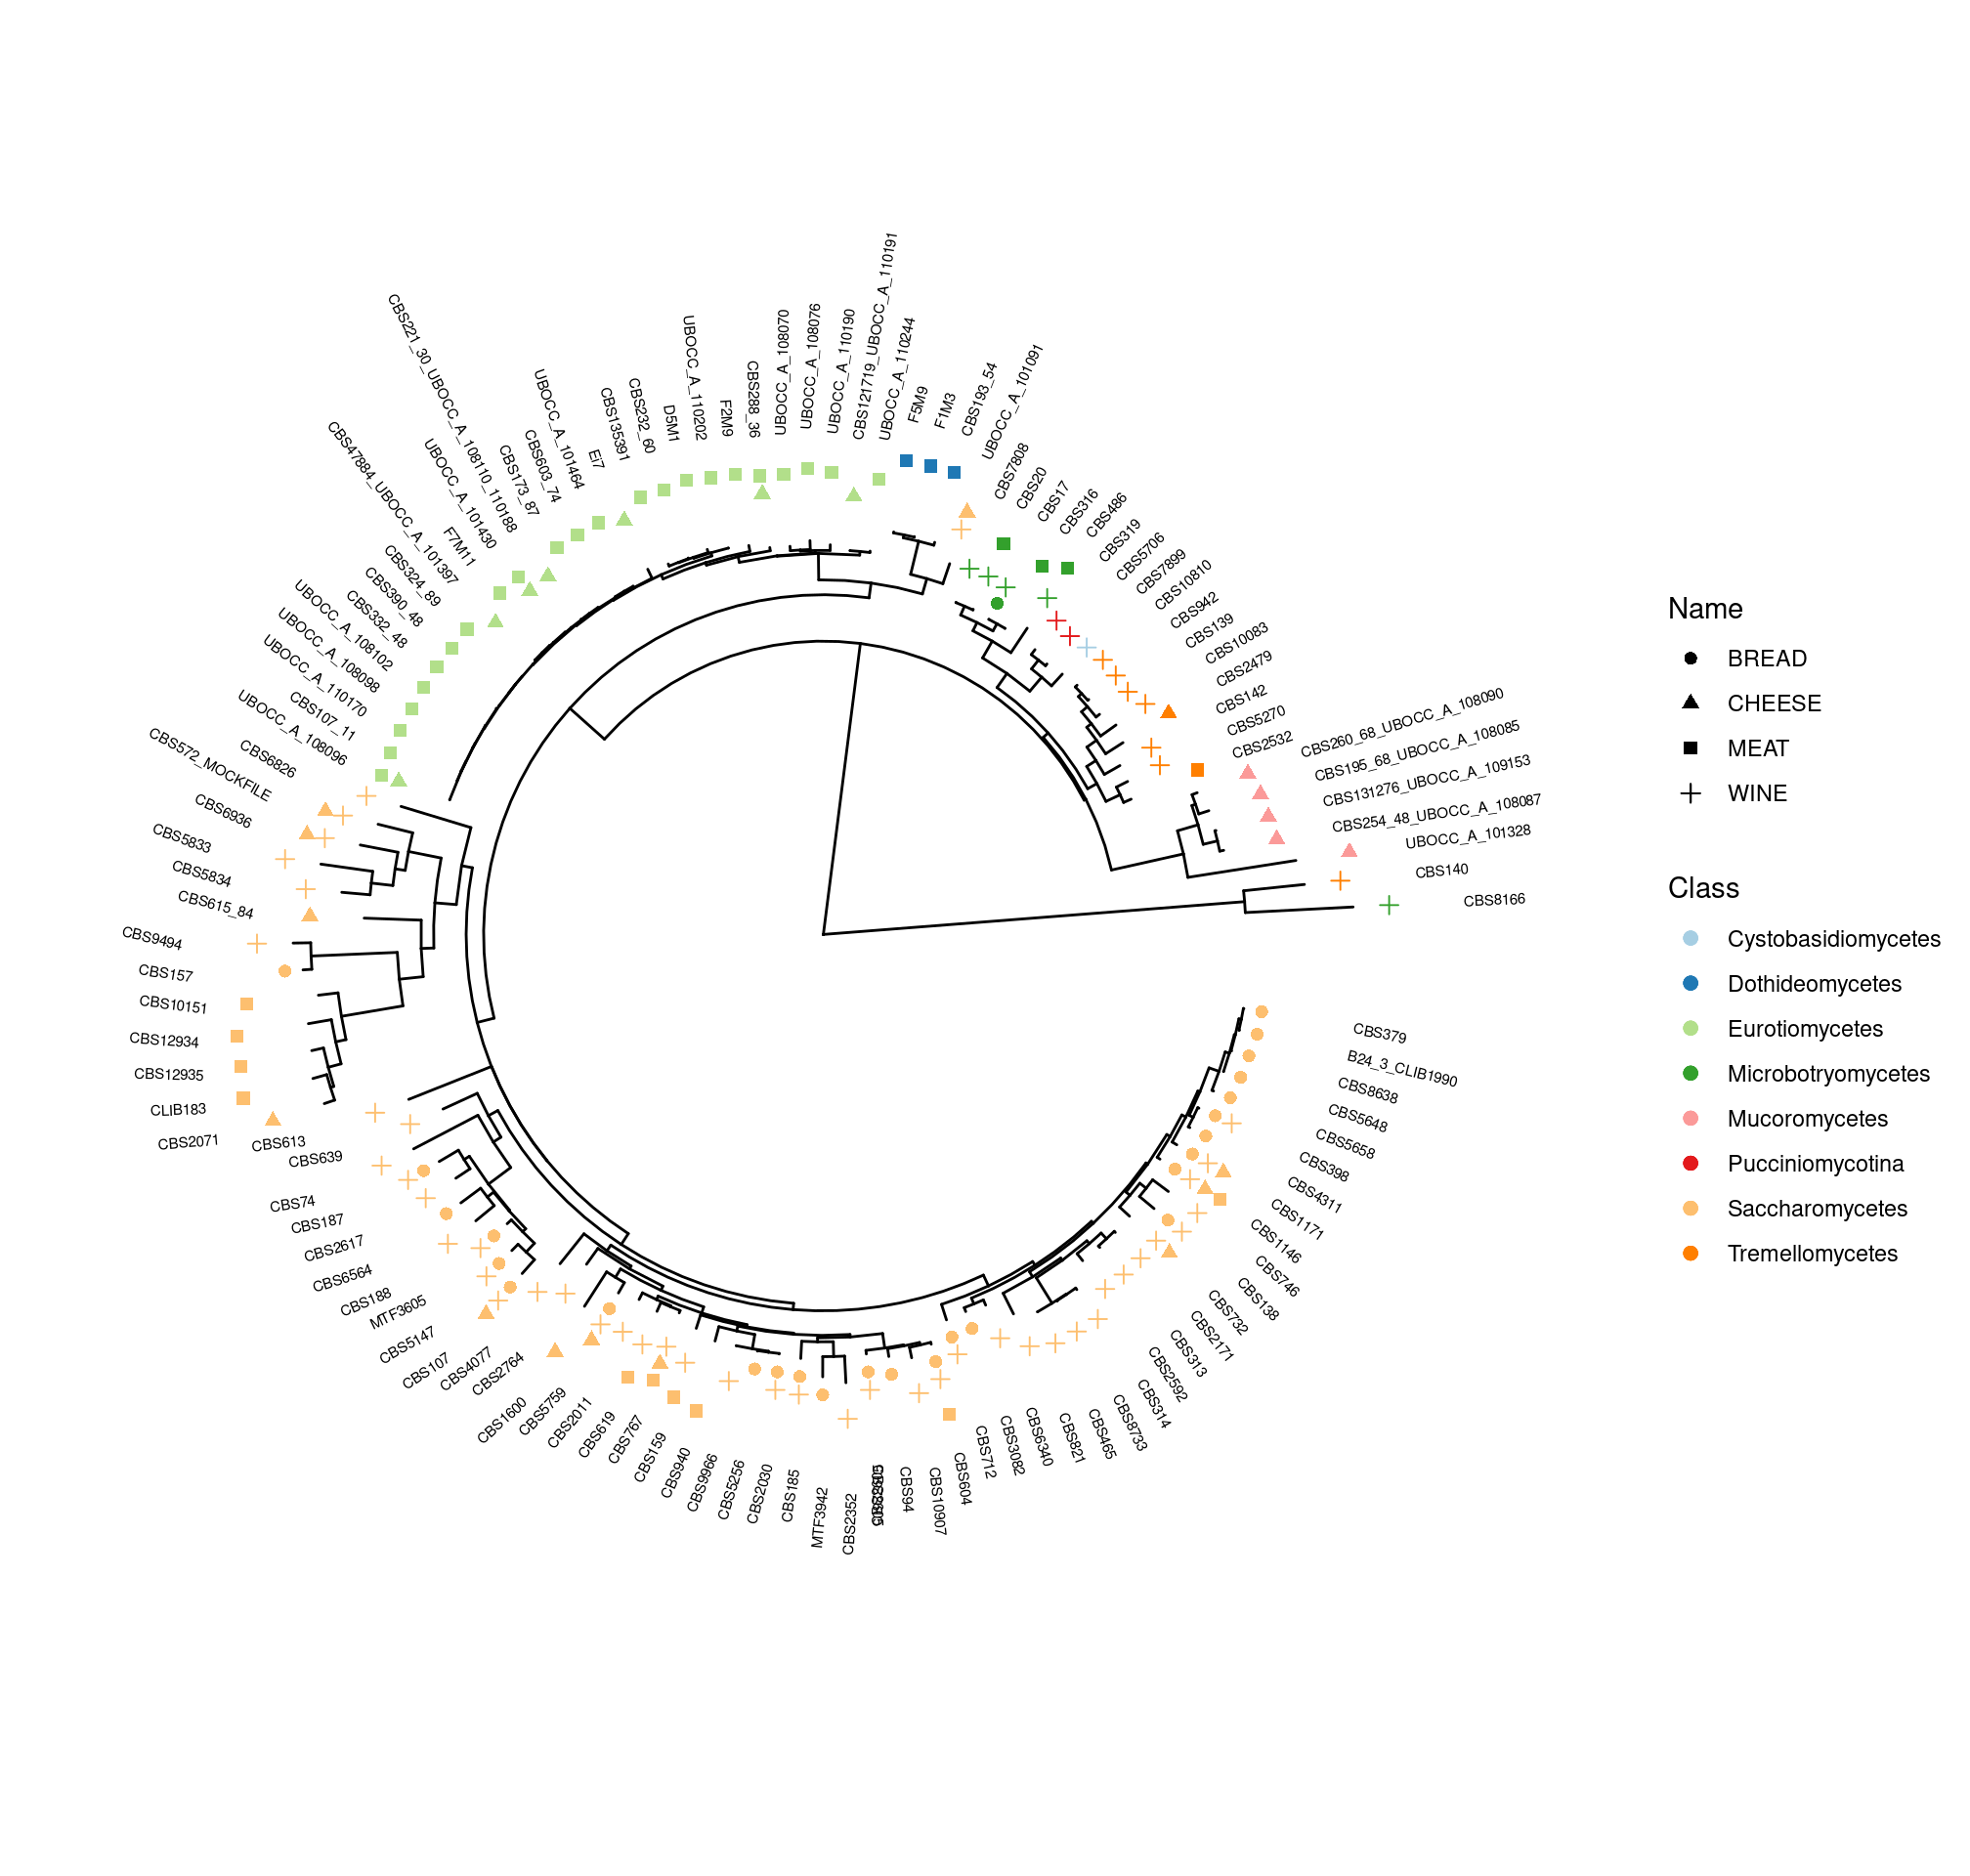
Methods
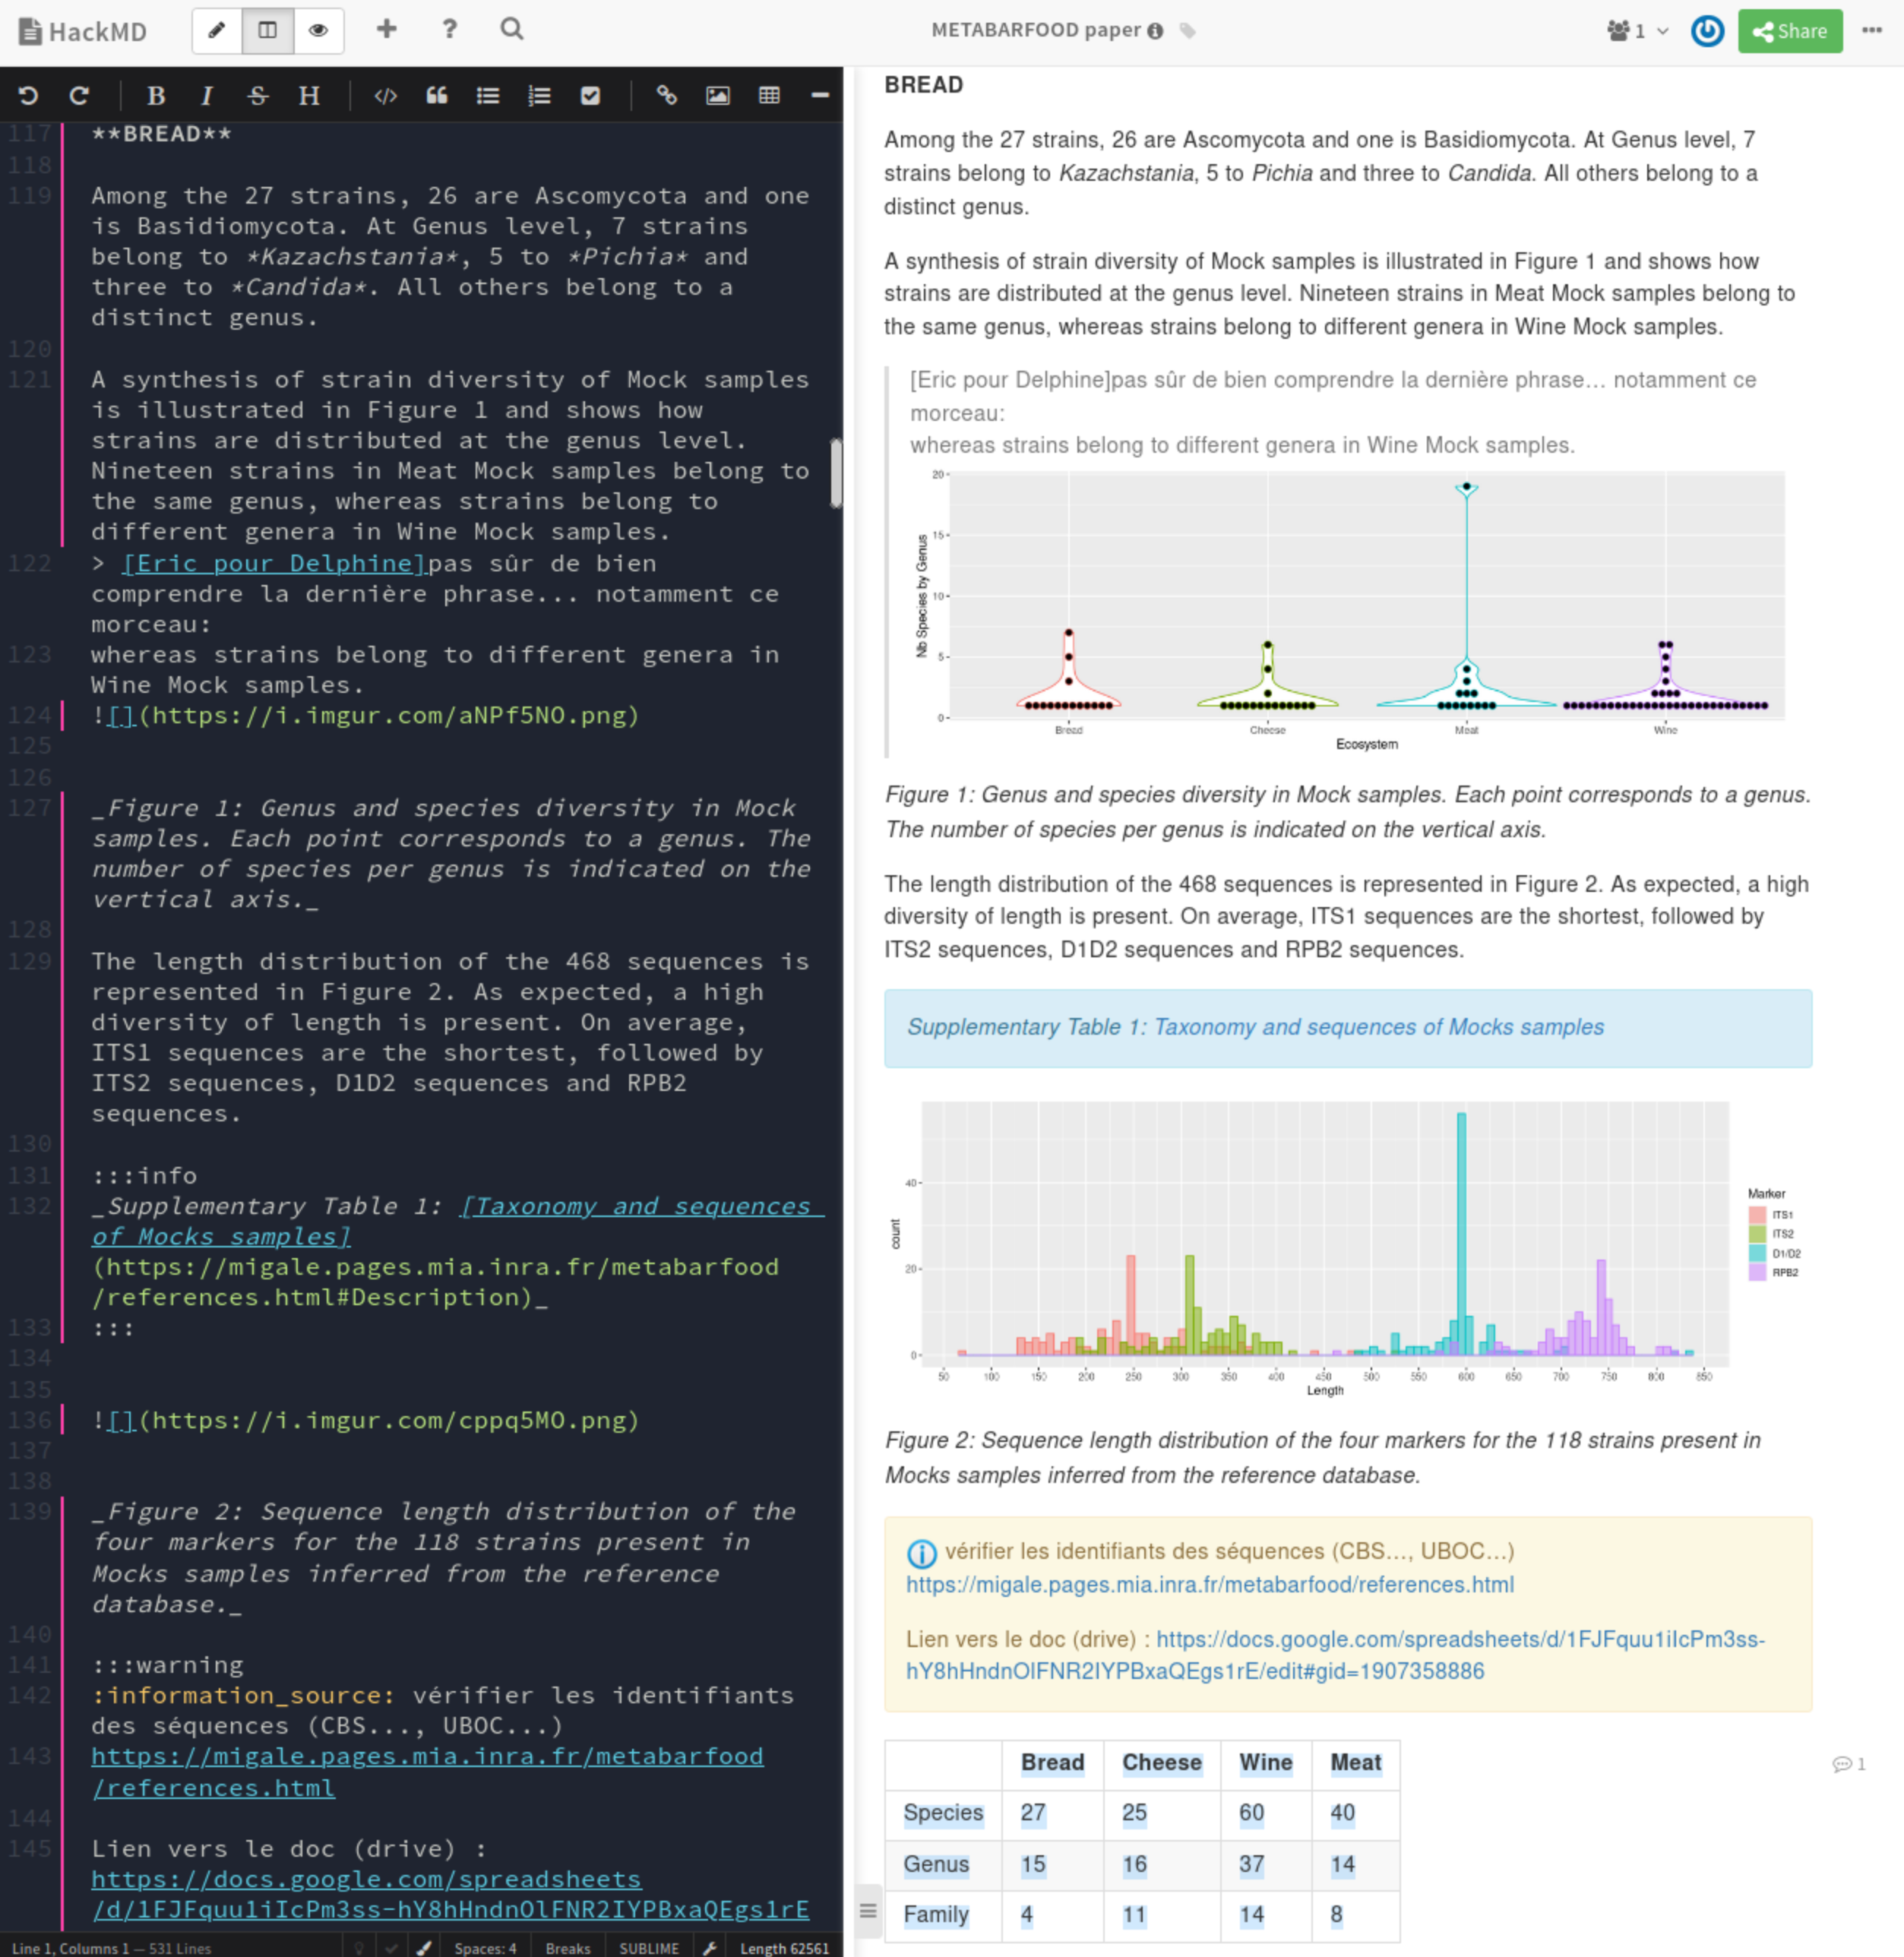
- For each fermented food type, representative species were selected based on an inventory of the most frequently described species in the literature. One strain (mainly available type-strains) was included for each selected species.
| Bread | Cheese | Meat | Wine | |
|---|---|---|---|---|
| Species | 27 | 25 | 40 | 60 |
| Genus | 15 | 16 | 14 | 37 |
| Family | 4 | 11 | 8 | 8 |
Methods
- For each food environment (bread, wine, cheese, fermented meat), two different mock communities were prepared, a “DNA” mock community and a “PCR” mock community.
- All mock community samples were prepared in triplicate.
Methods
- Each of the 469 sequences used in mock communities was identified (from INRAE labs, public genomes, dedicated databanks…) (Claire Vincent, M2 internship 2020, MaIAGE) and is part of the reference databank used for bioinformatics
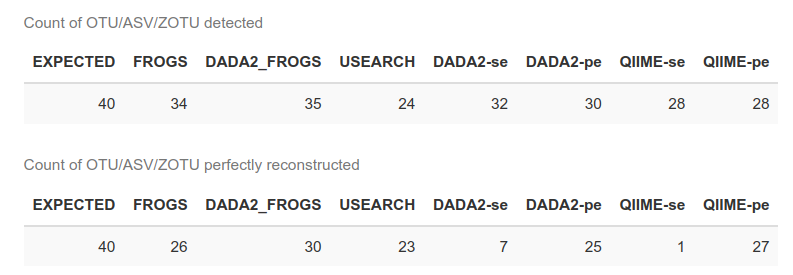
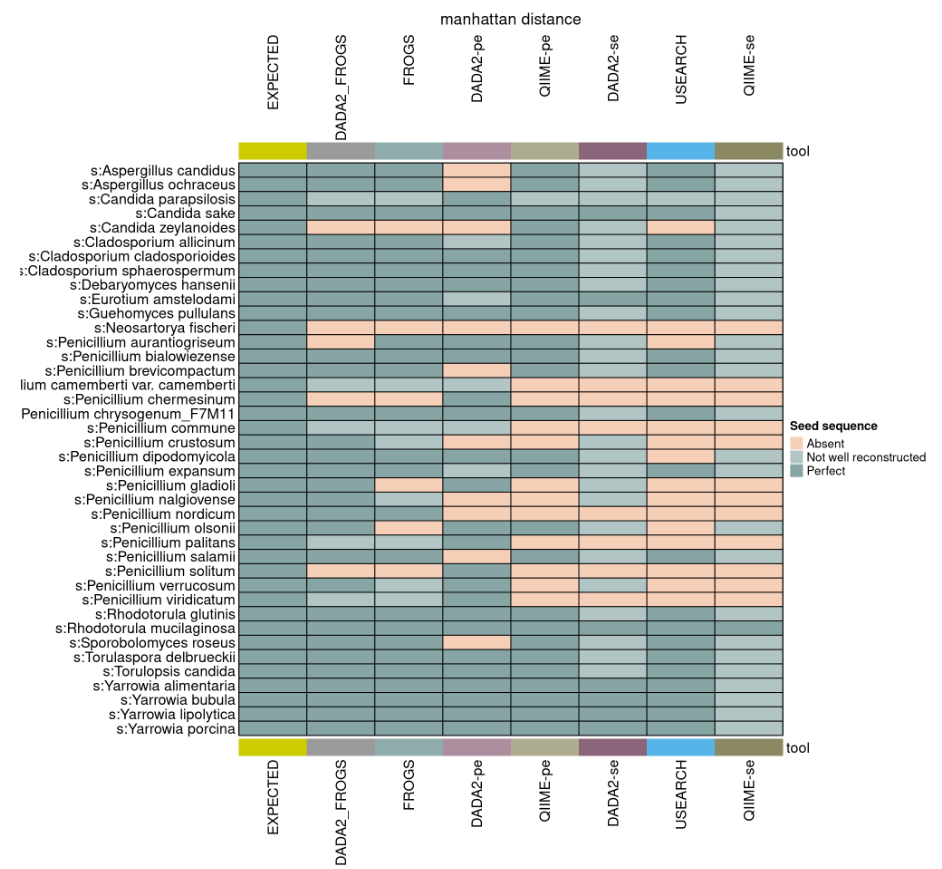
Benchmark
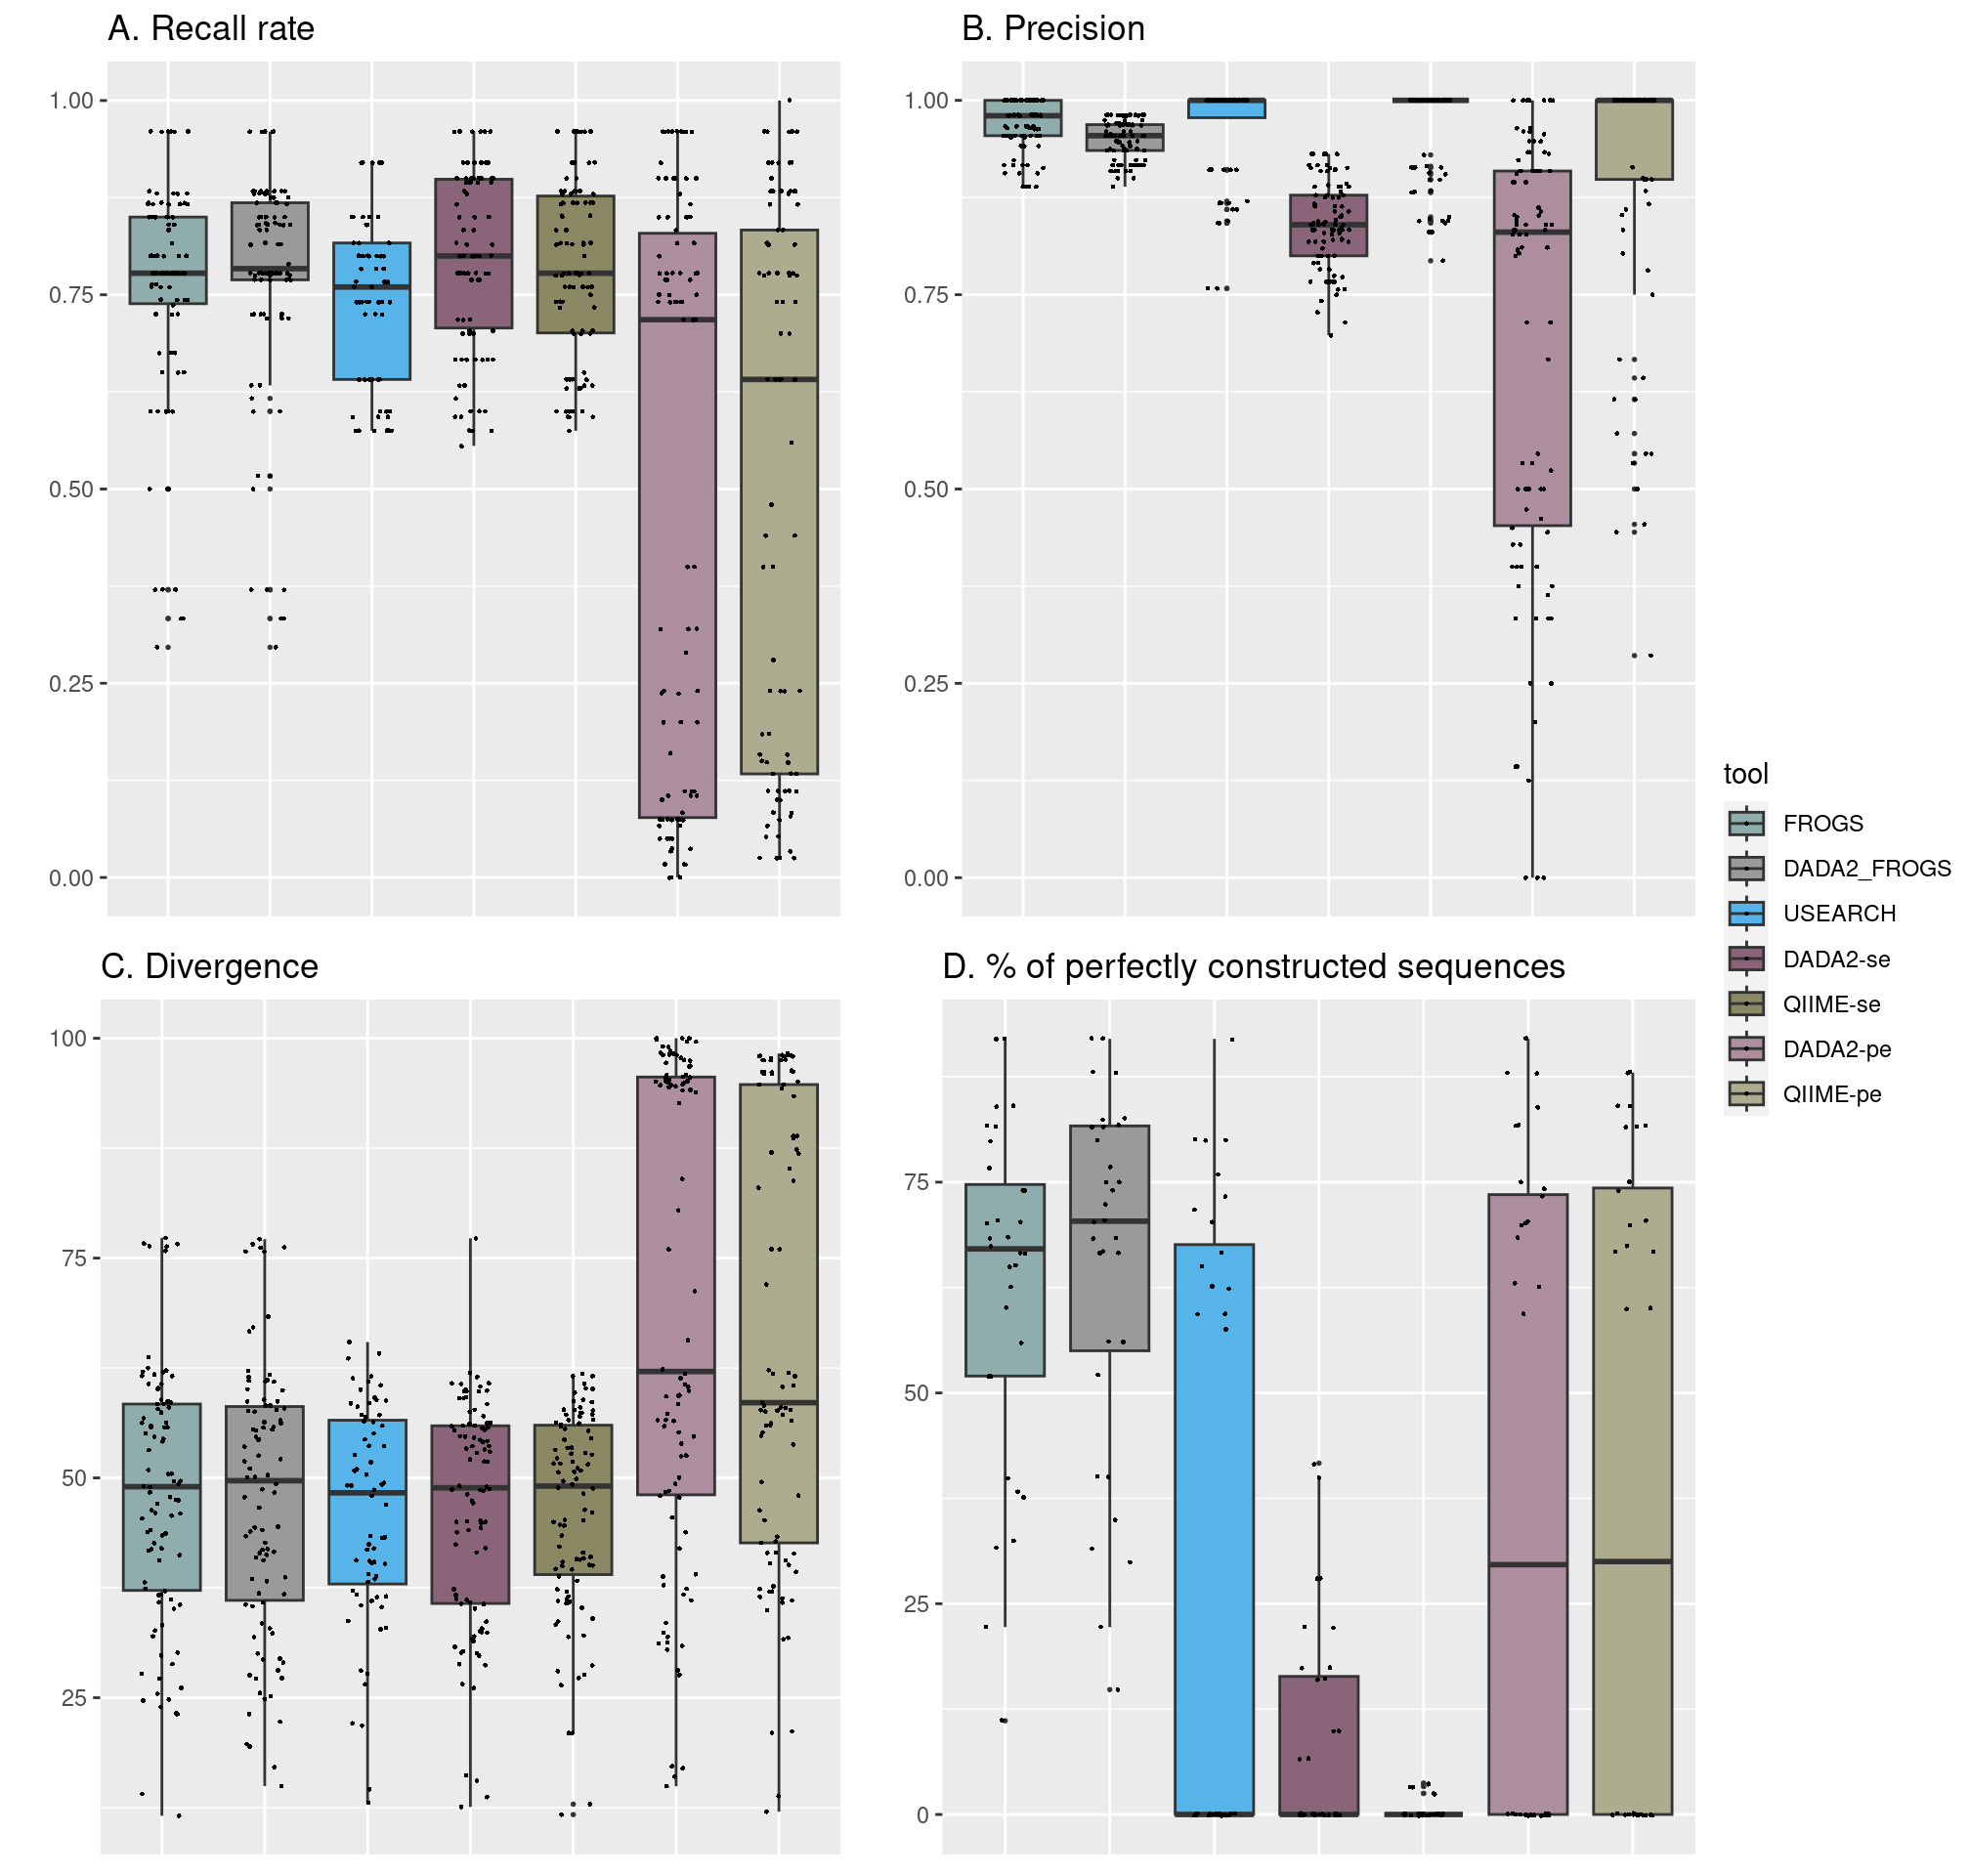
- A. Recall rate lower for pe tools
- B. DADA2 less precise than others
- C. Higher divergence for pe tools
- D. FROGS and DADA2_FROGS better
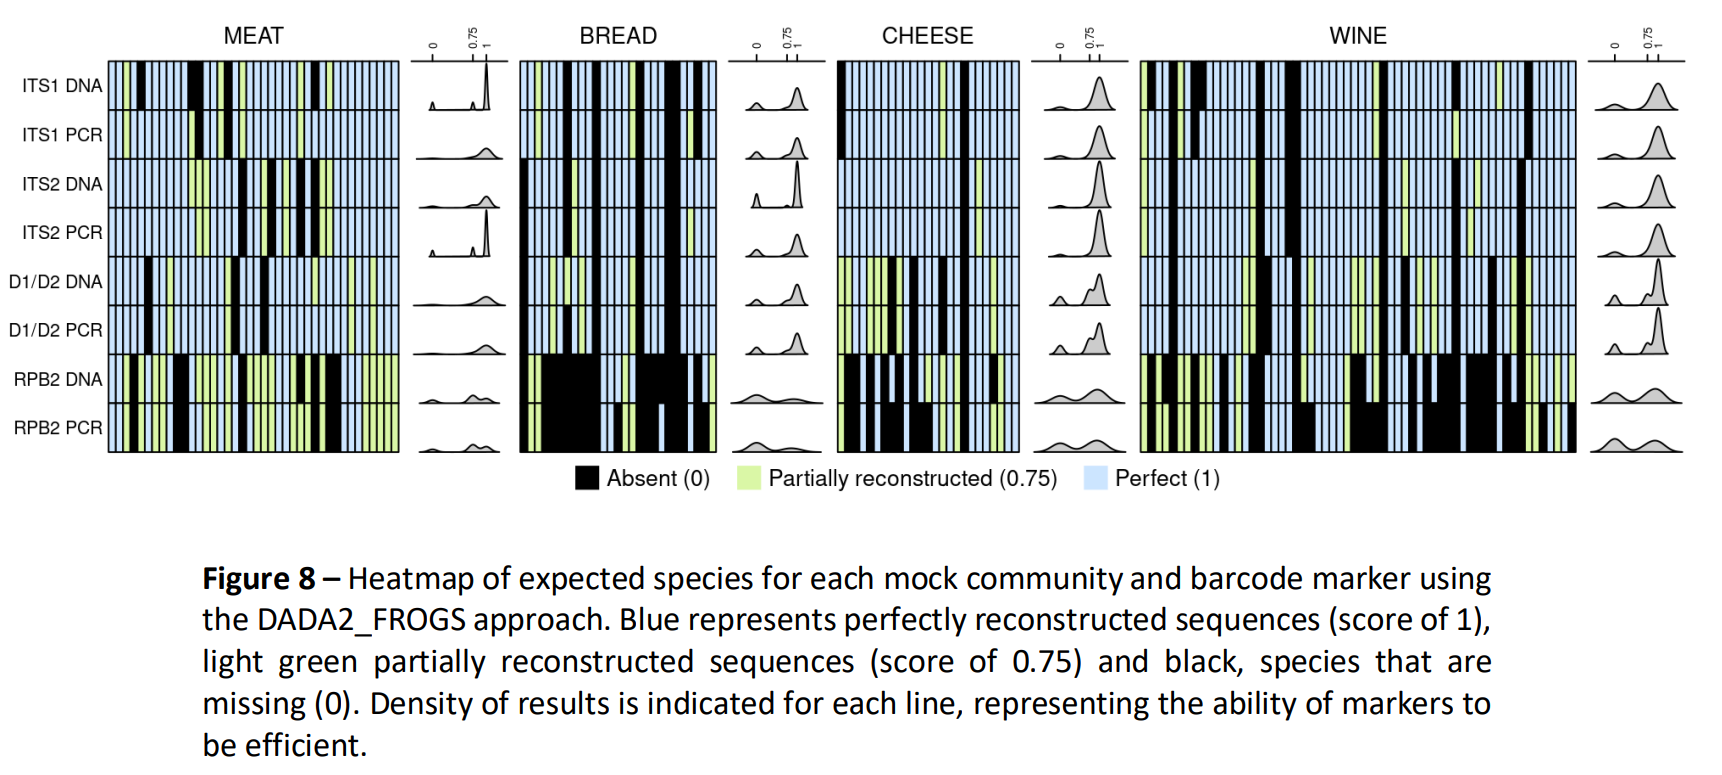
Benchmark
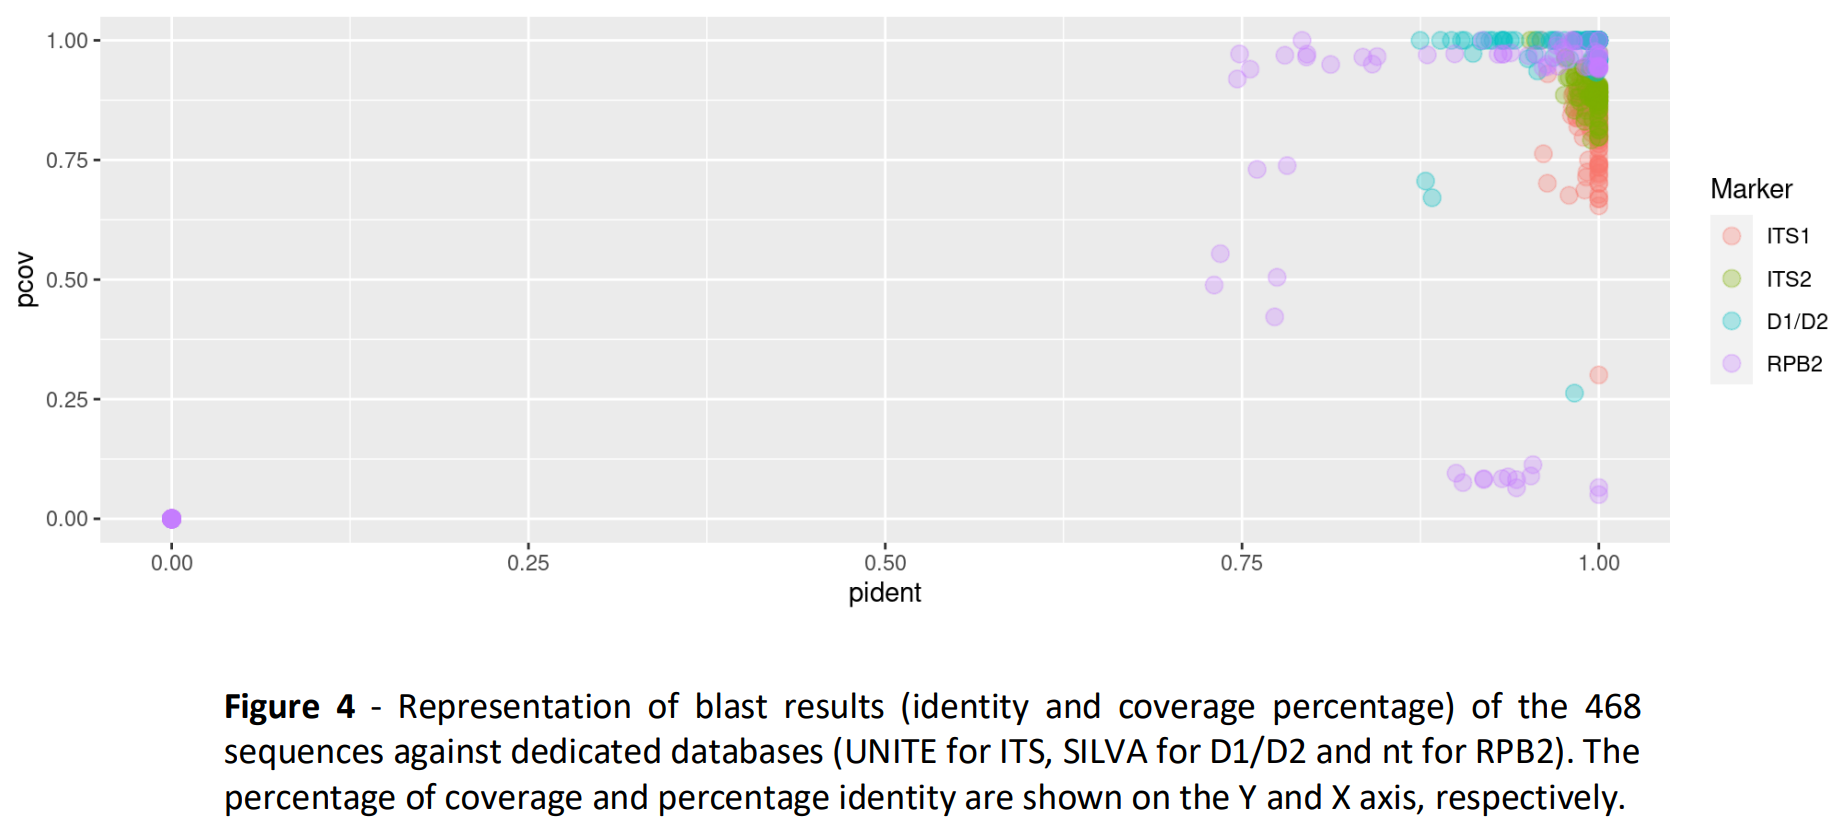
Marker choice on mock communities
Importance of the reference databanks
A long-term project
- COVID-19, other priorities…
- Reclaiming leadership to mobilize the troops
- Setting up collaborative tools
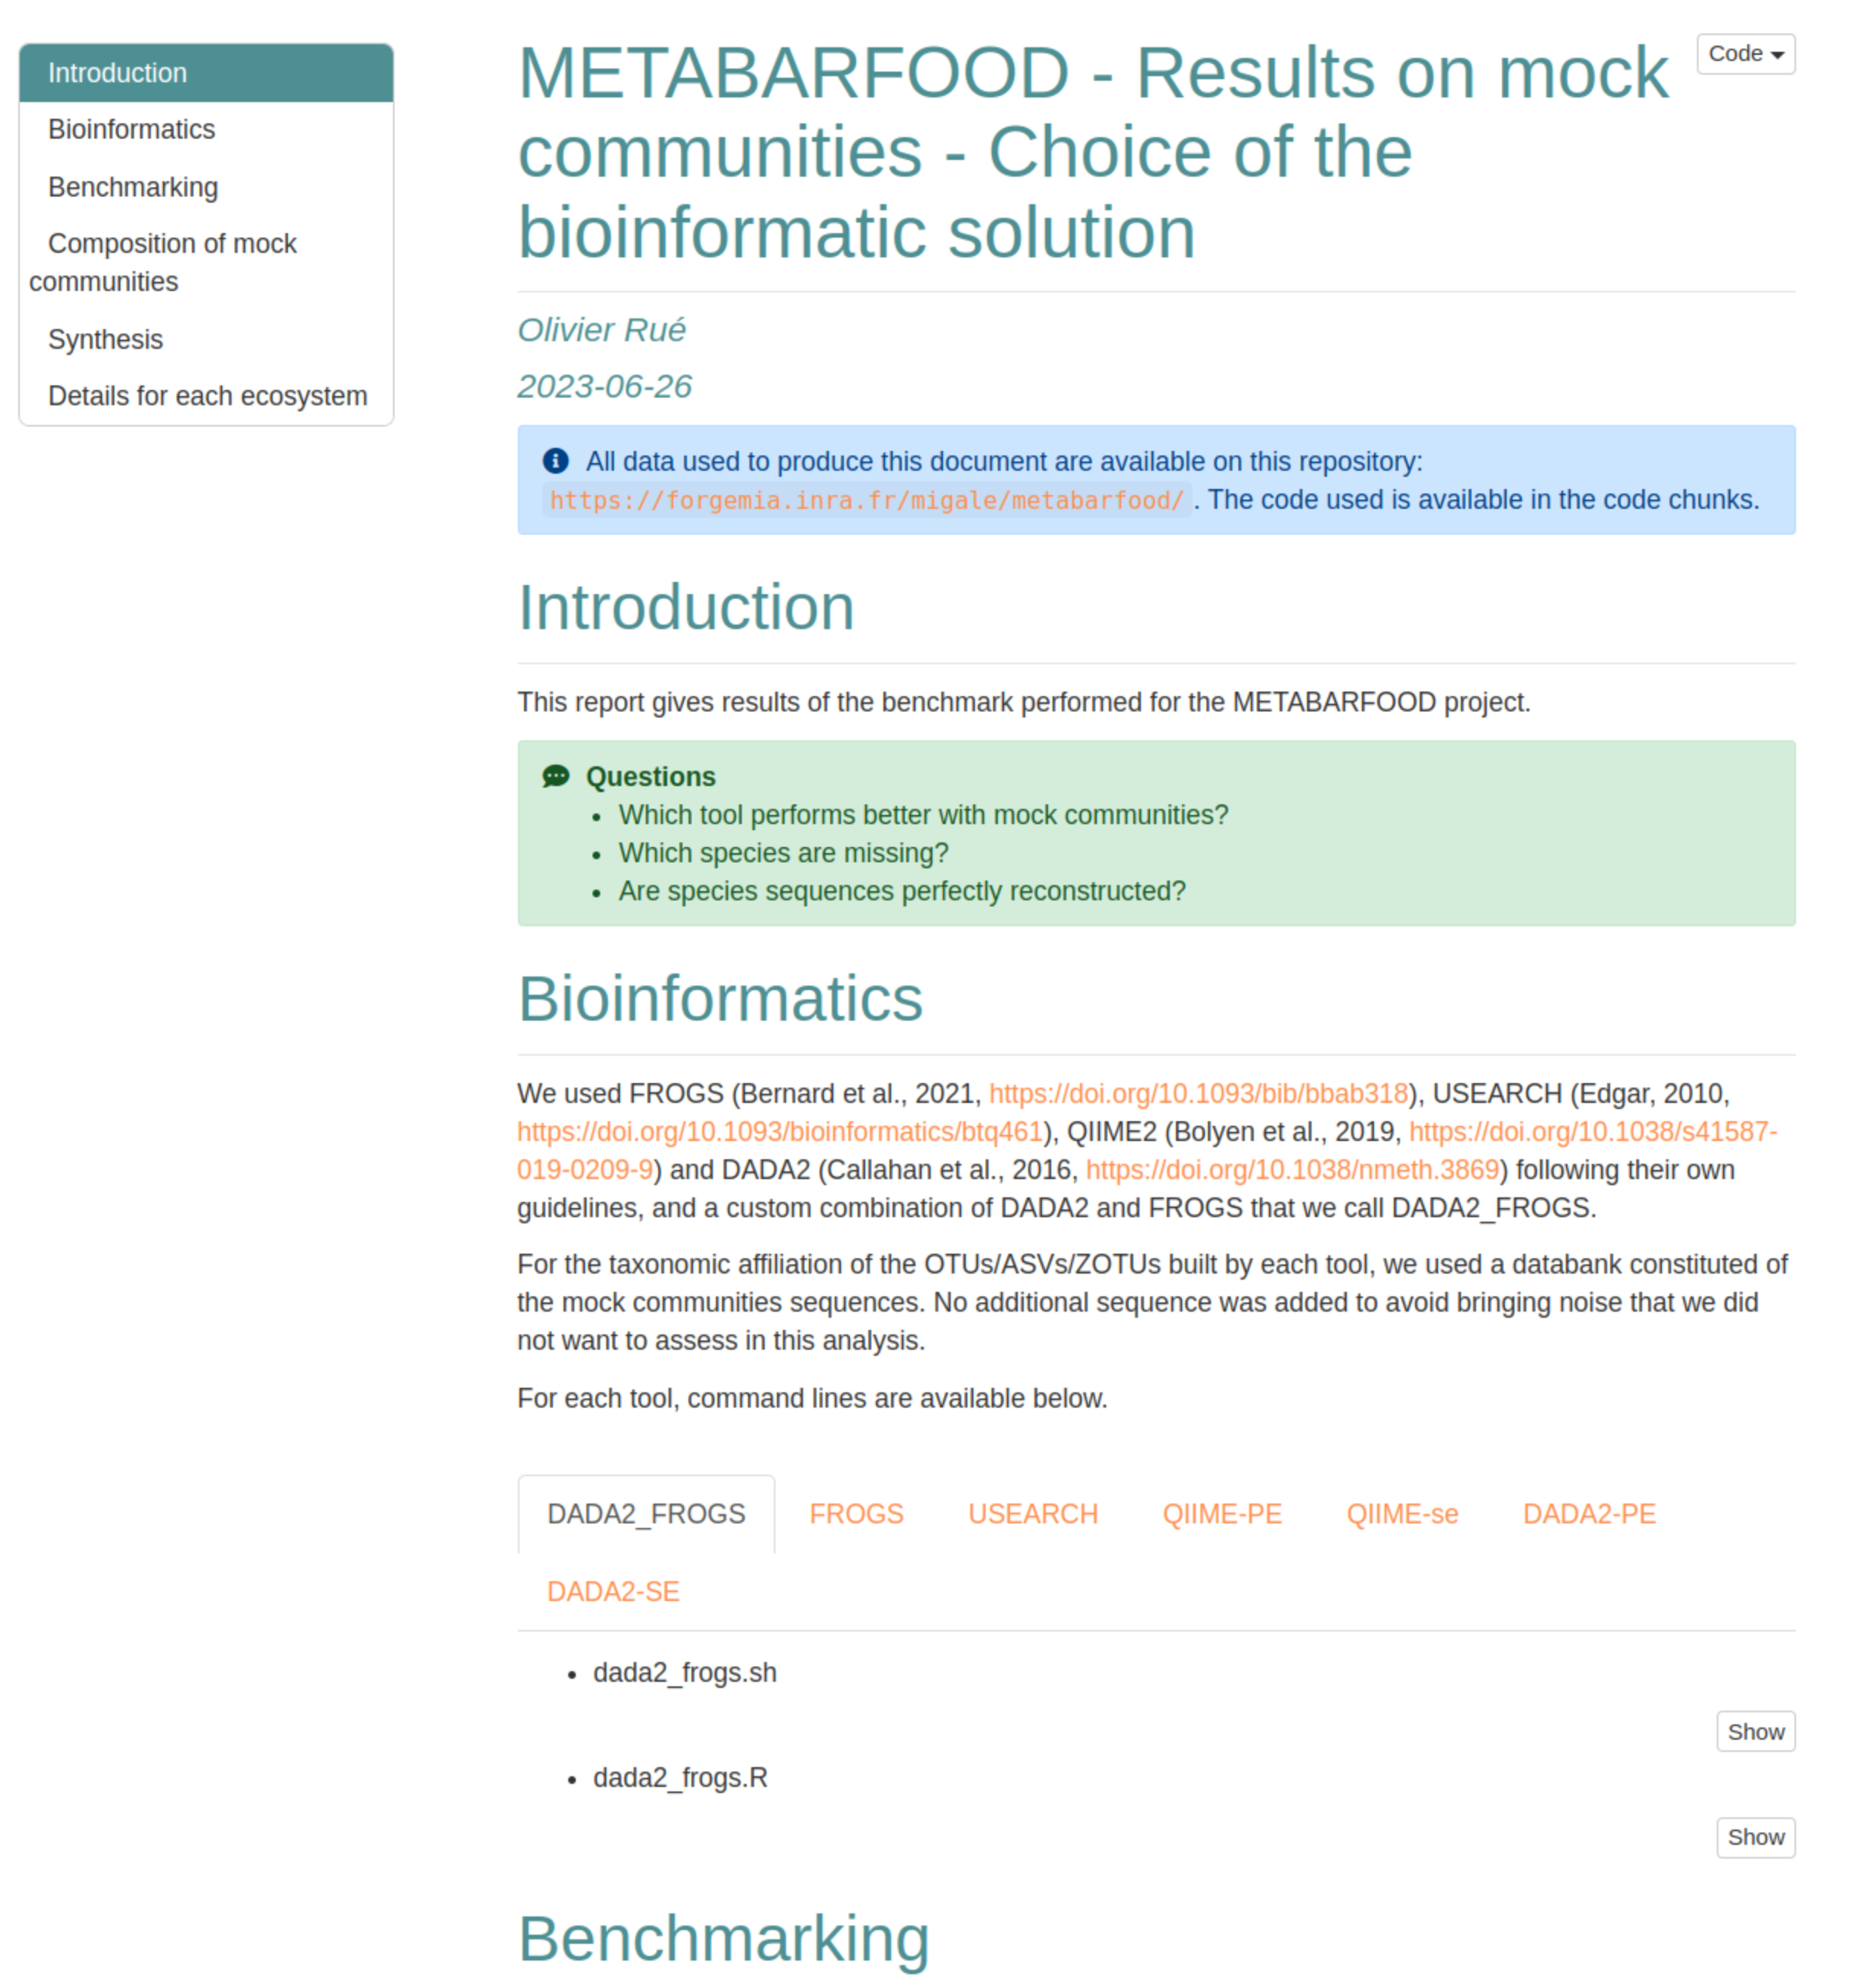
- Code deposited on forgeMIA
- continuous deployment of analyses reports
- reproducible analyses, a lot of time saving!
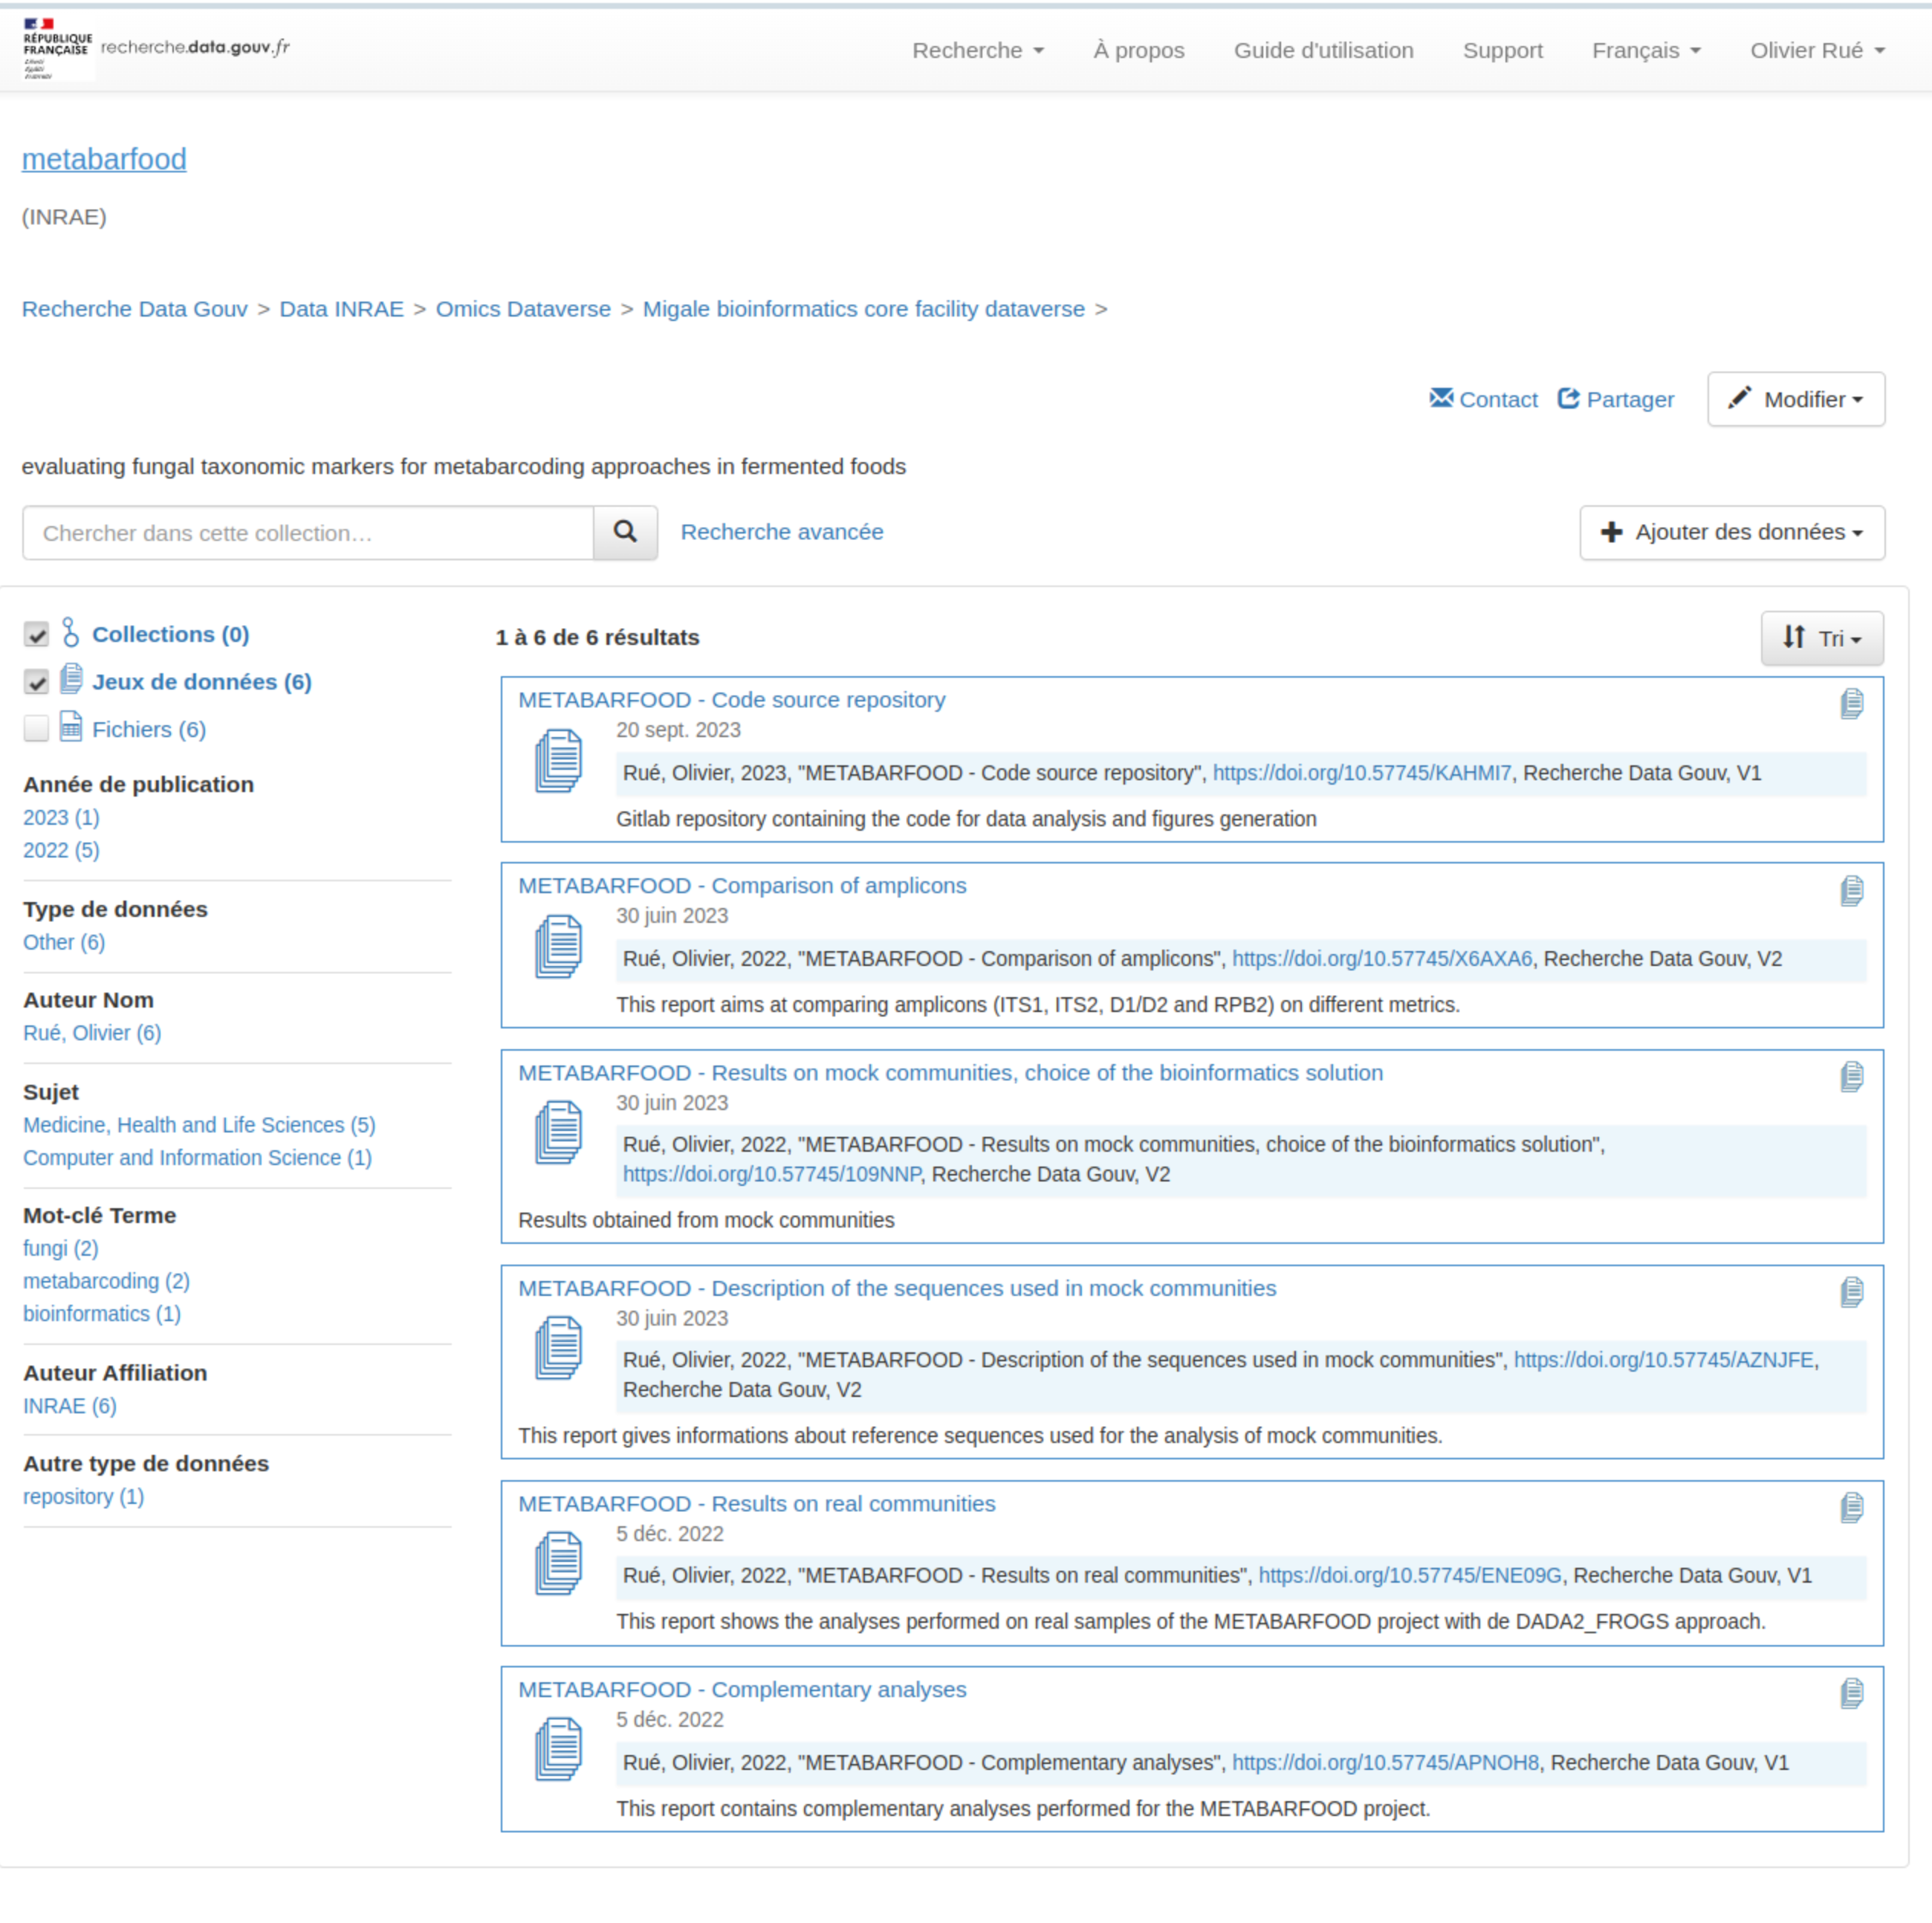
- Dedicated dataverse on Recherche Data Gouv / Code archived on HAL ↔︎ Software Heritage
- DADA2_FROGS approach being integrated in FROGS v.5.0
- Publication in Peer Community Journal in 2023