Analyse de données métagénomiques 16S - FROGS
Module 20
Olivier Rué 
MaIAGE - Migale
June 8, 2026
FROGS team
- FROGS is a INRAE development project since 2015

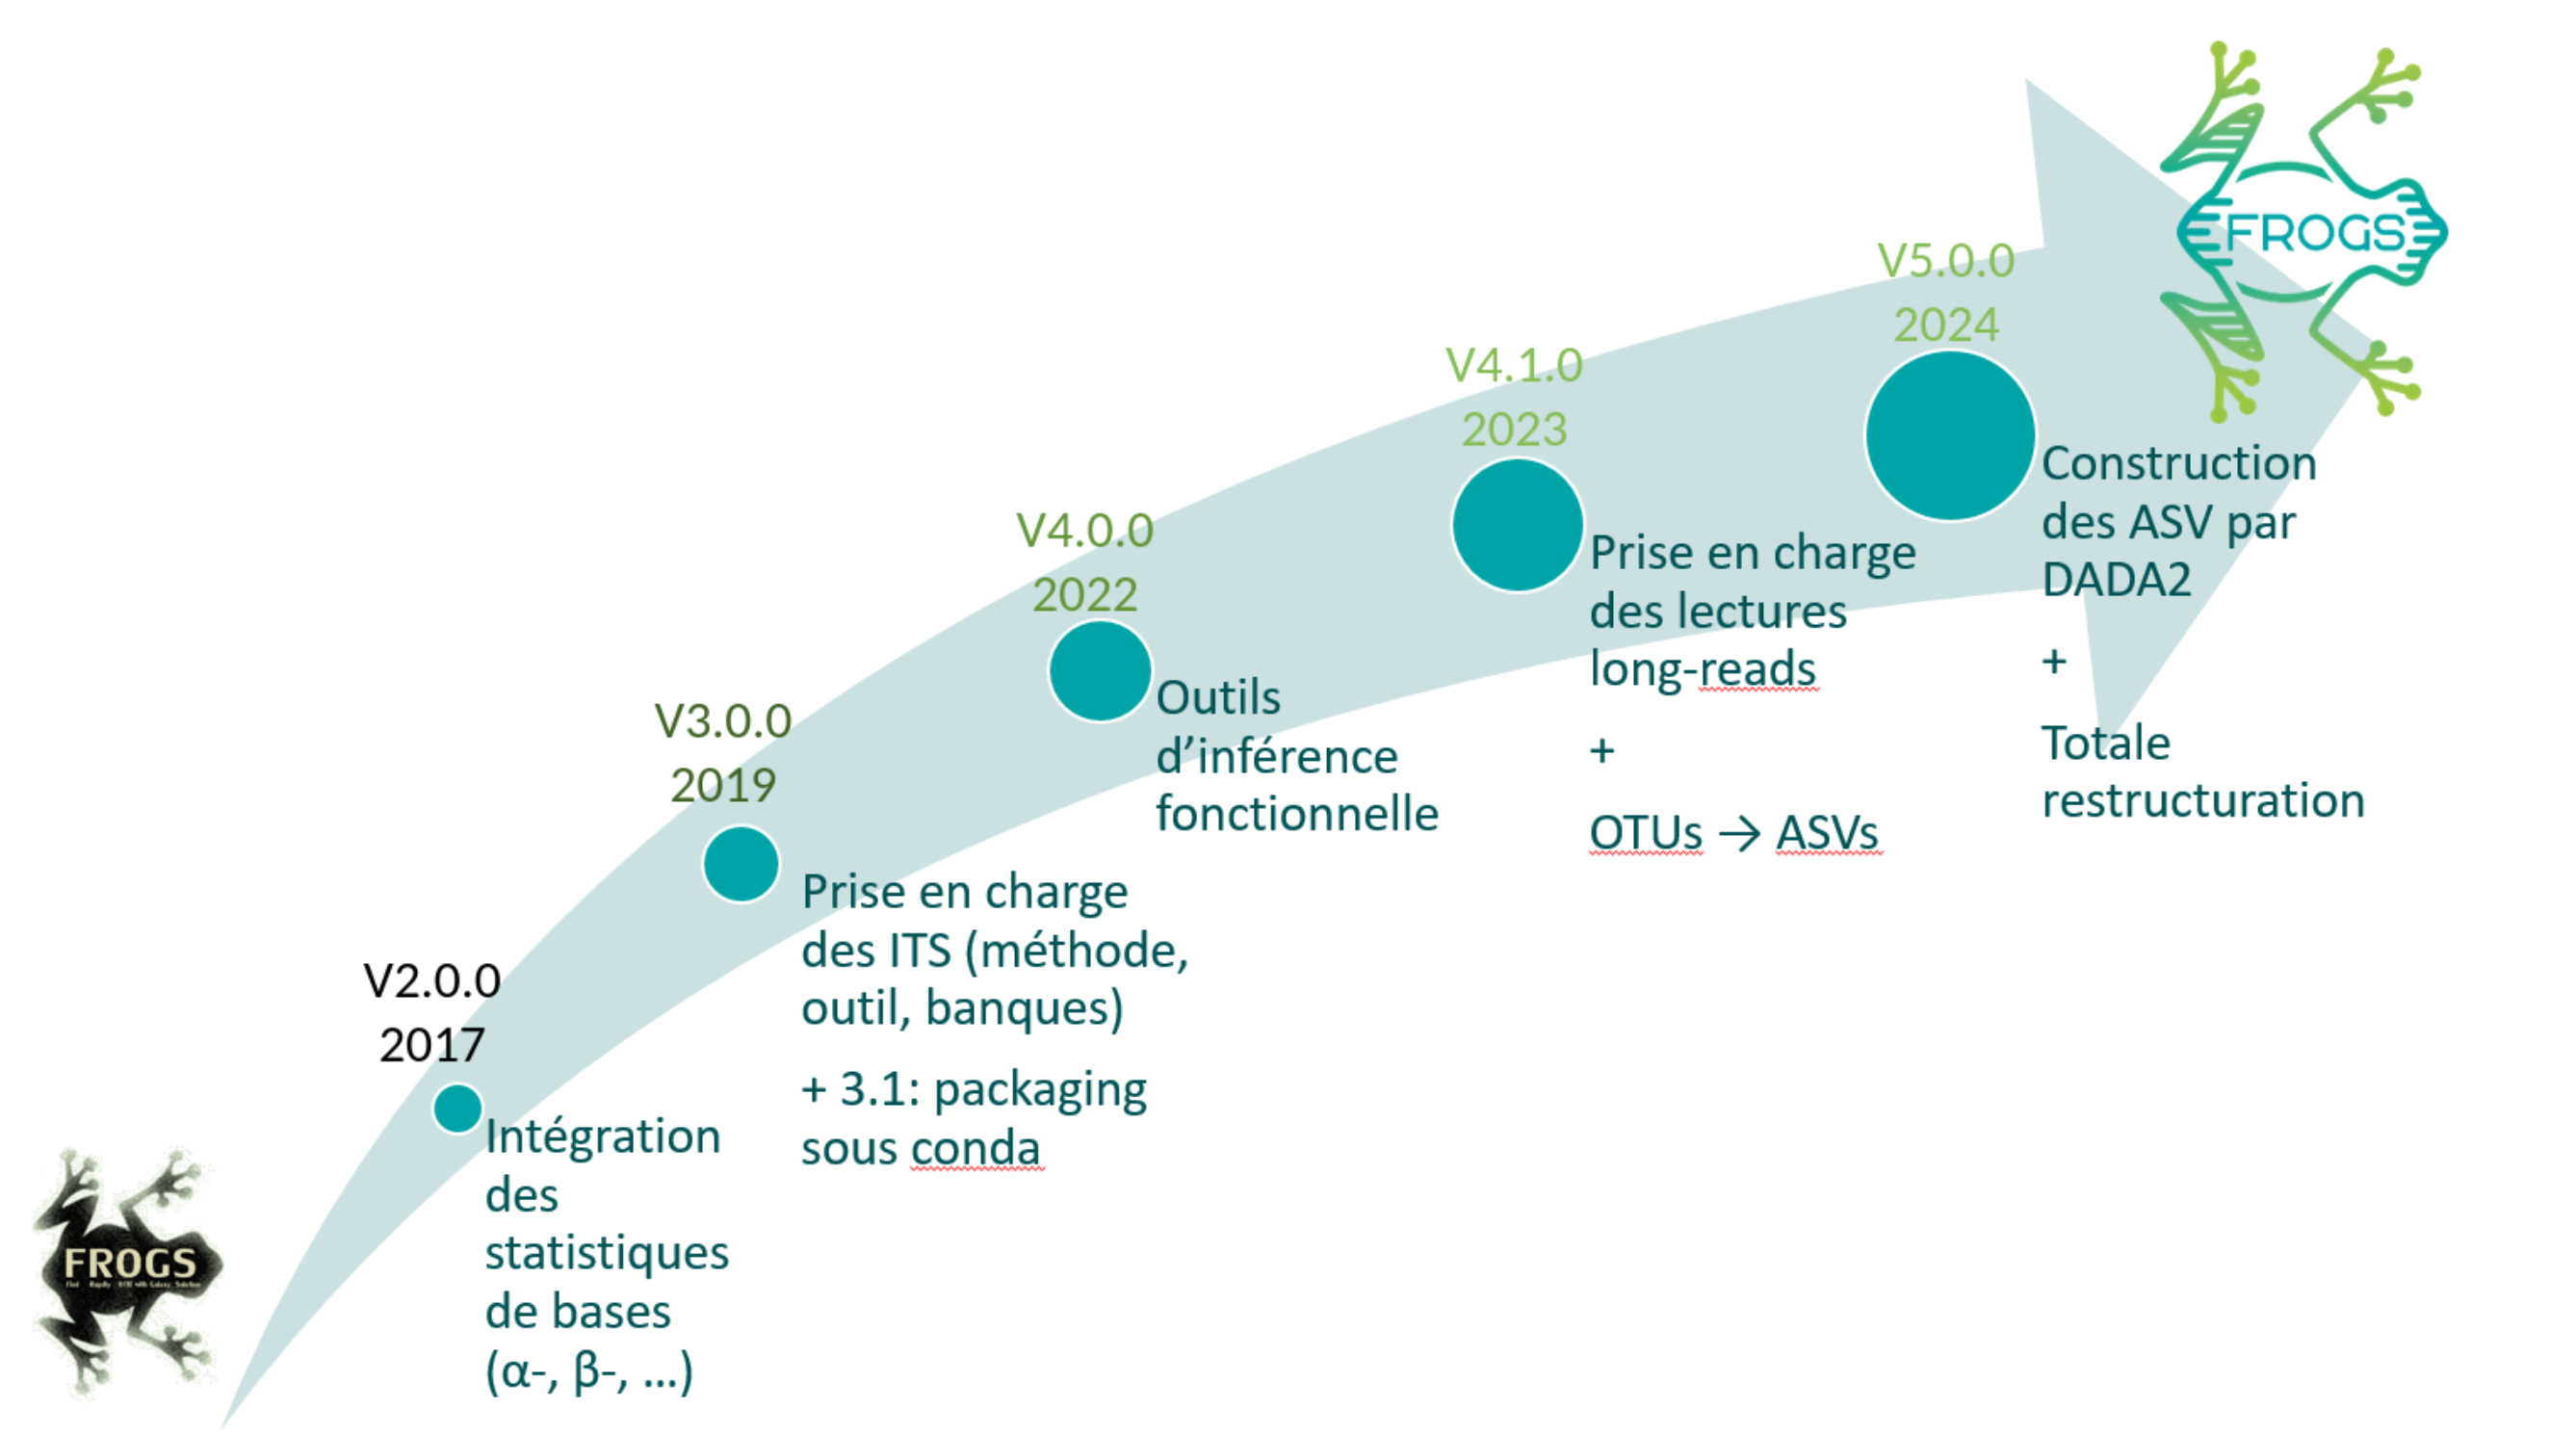
FROGS evolution
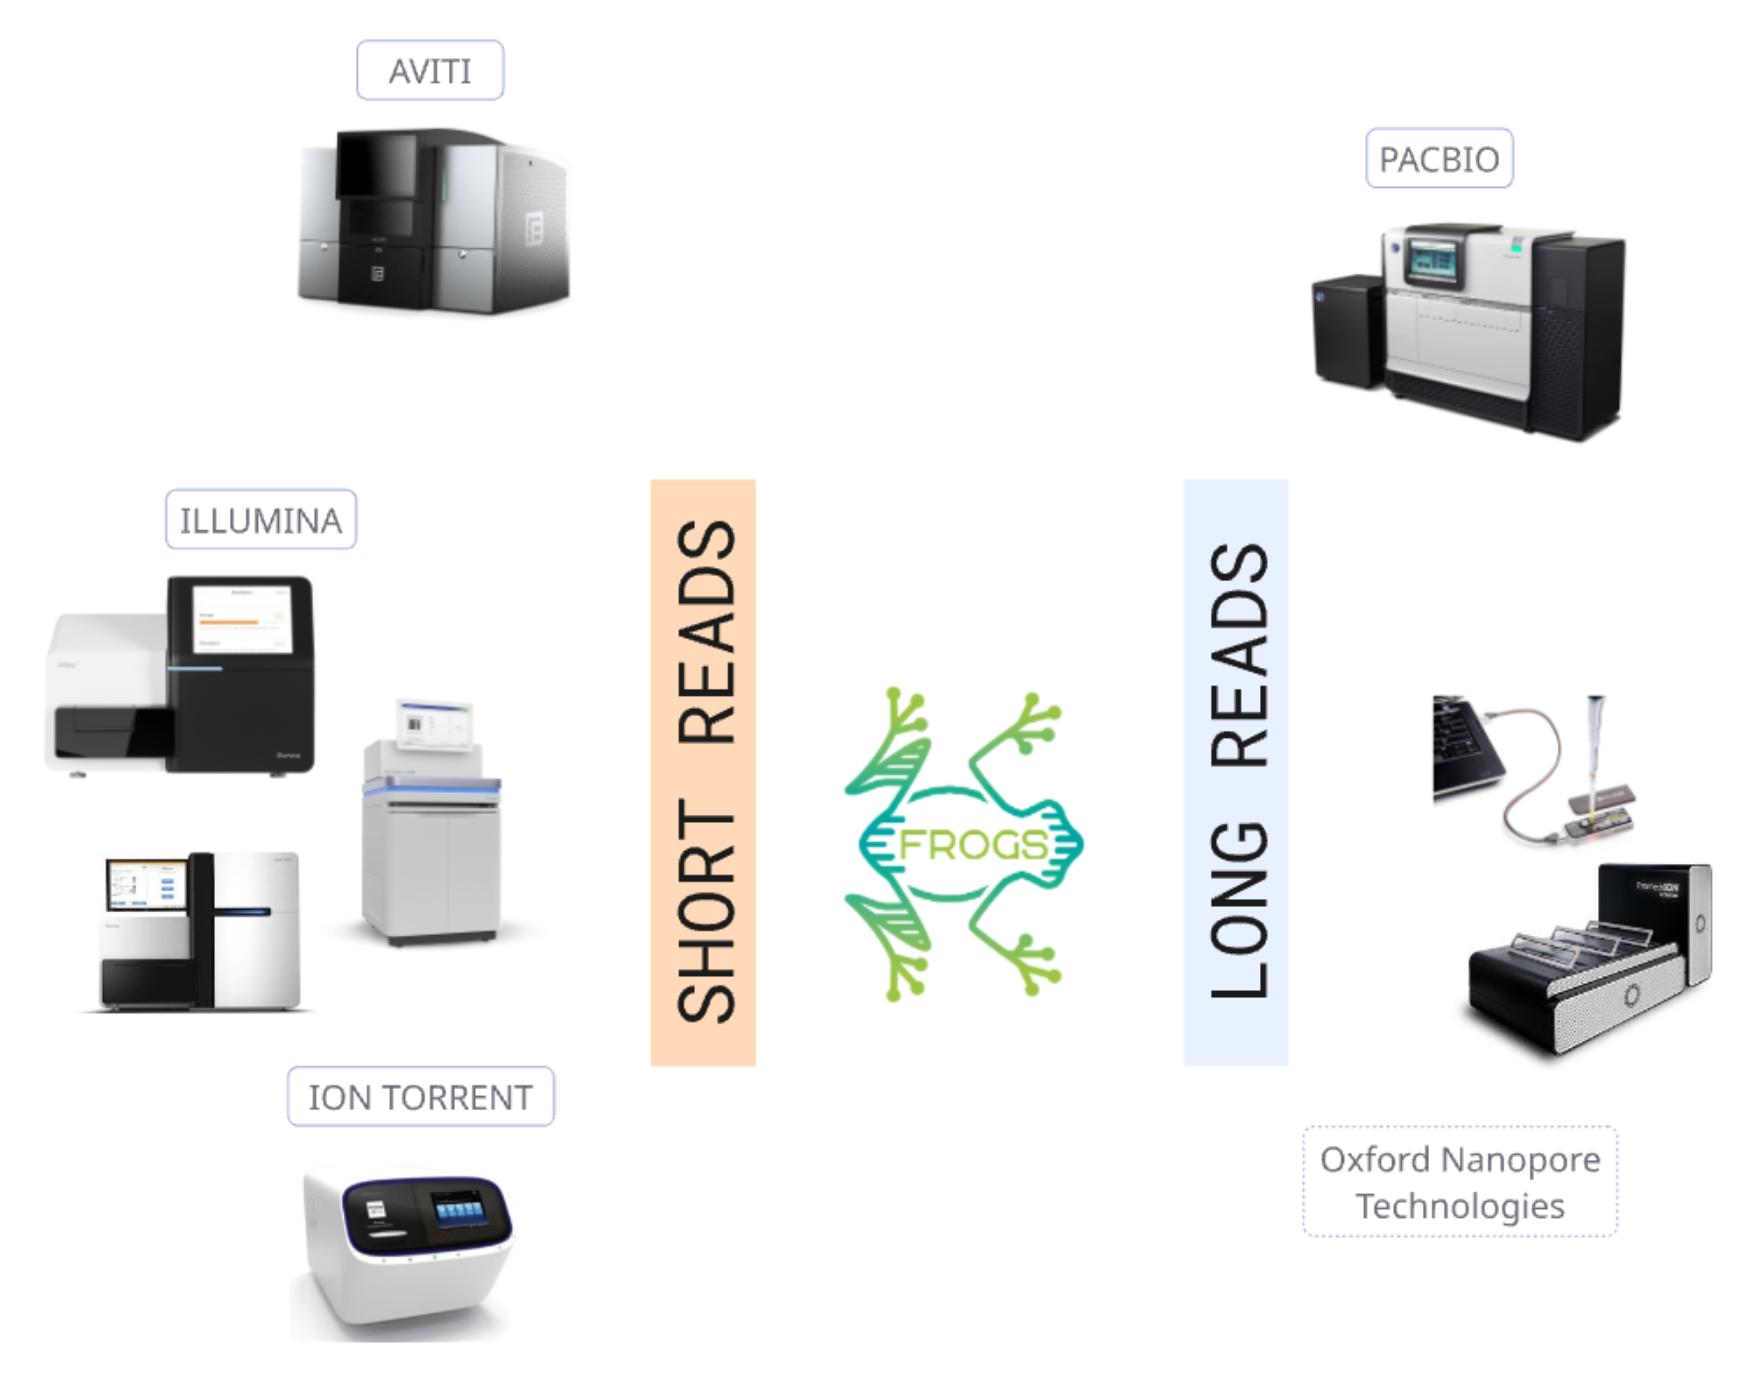
FROGS deals with long and short reads
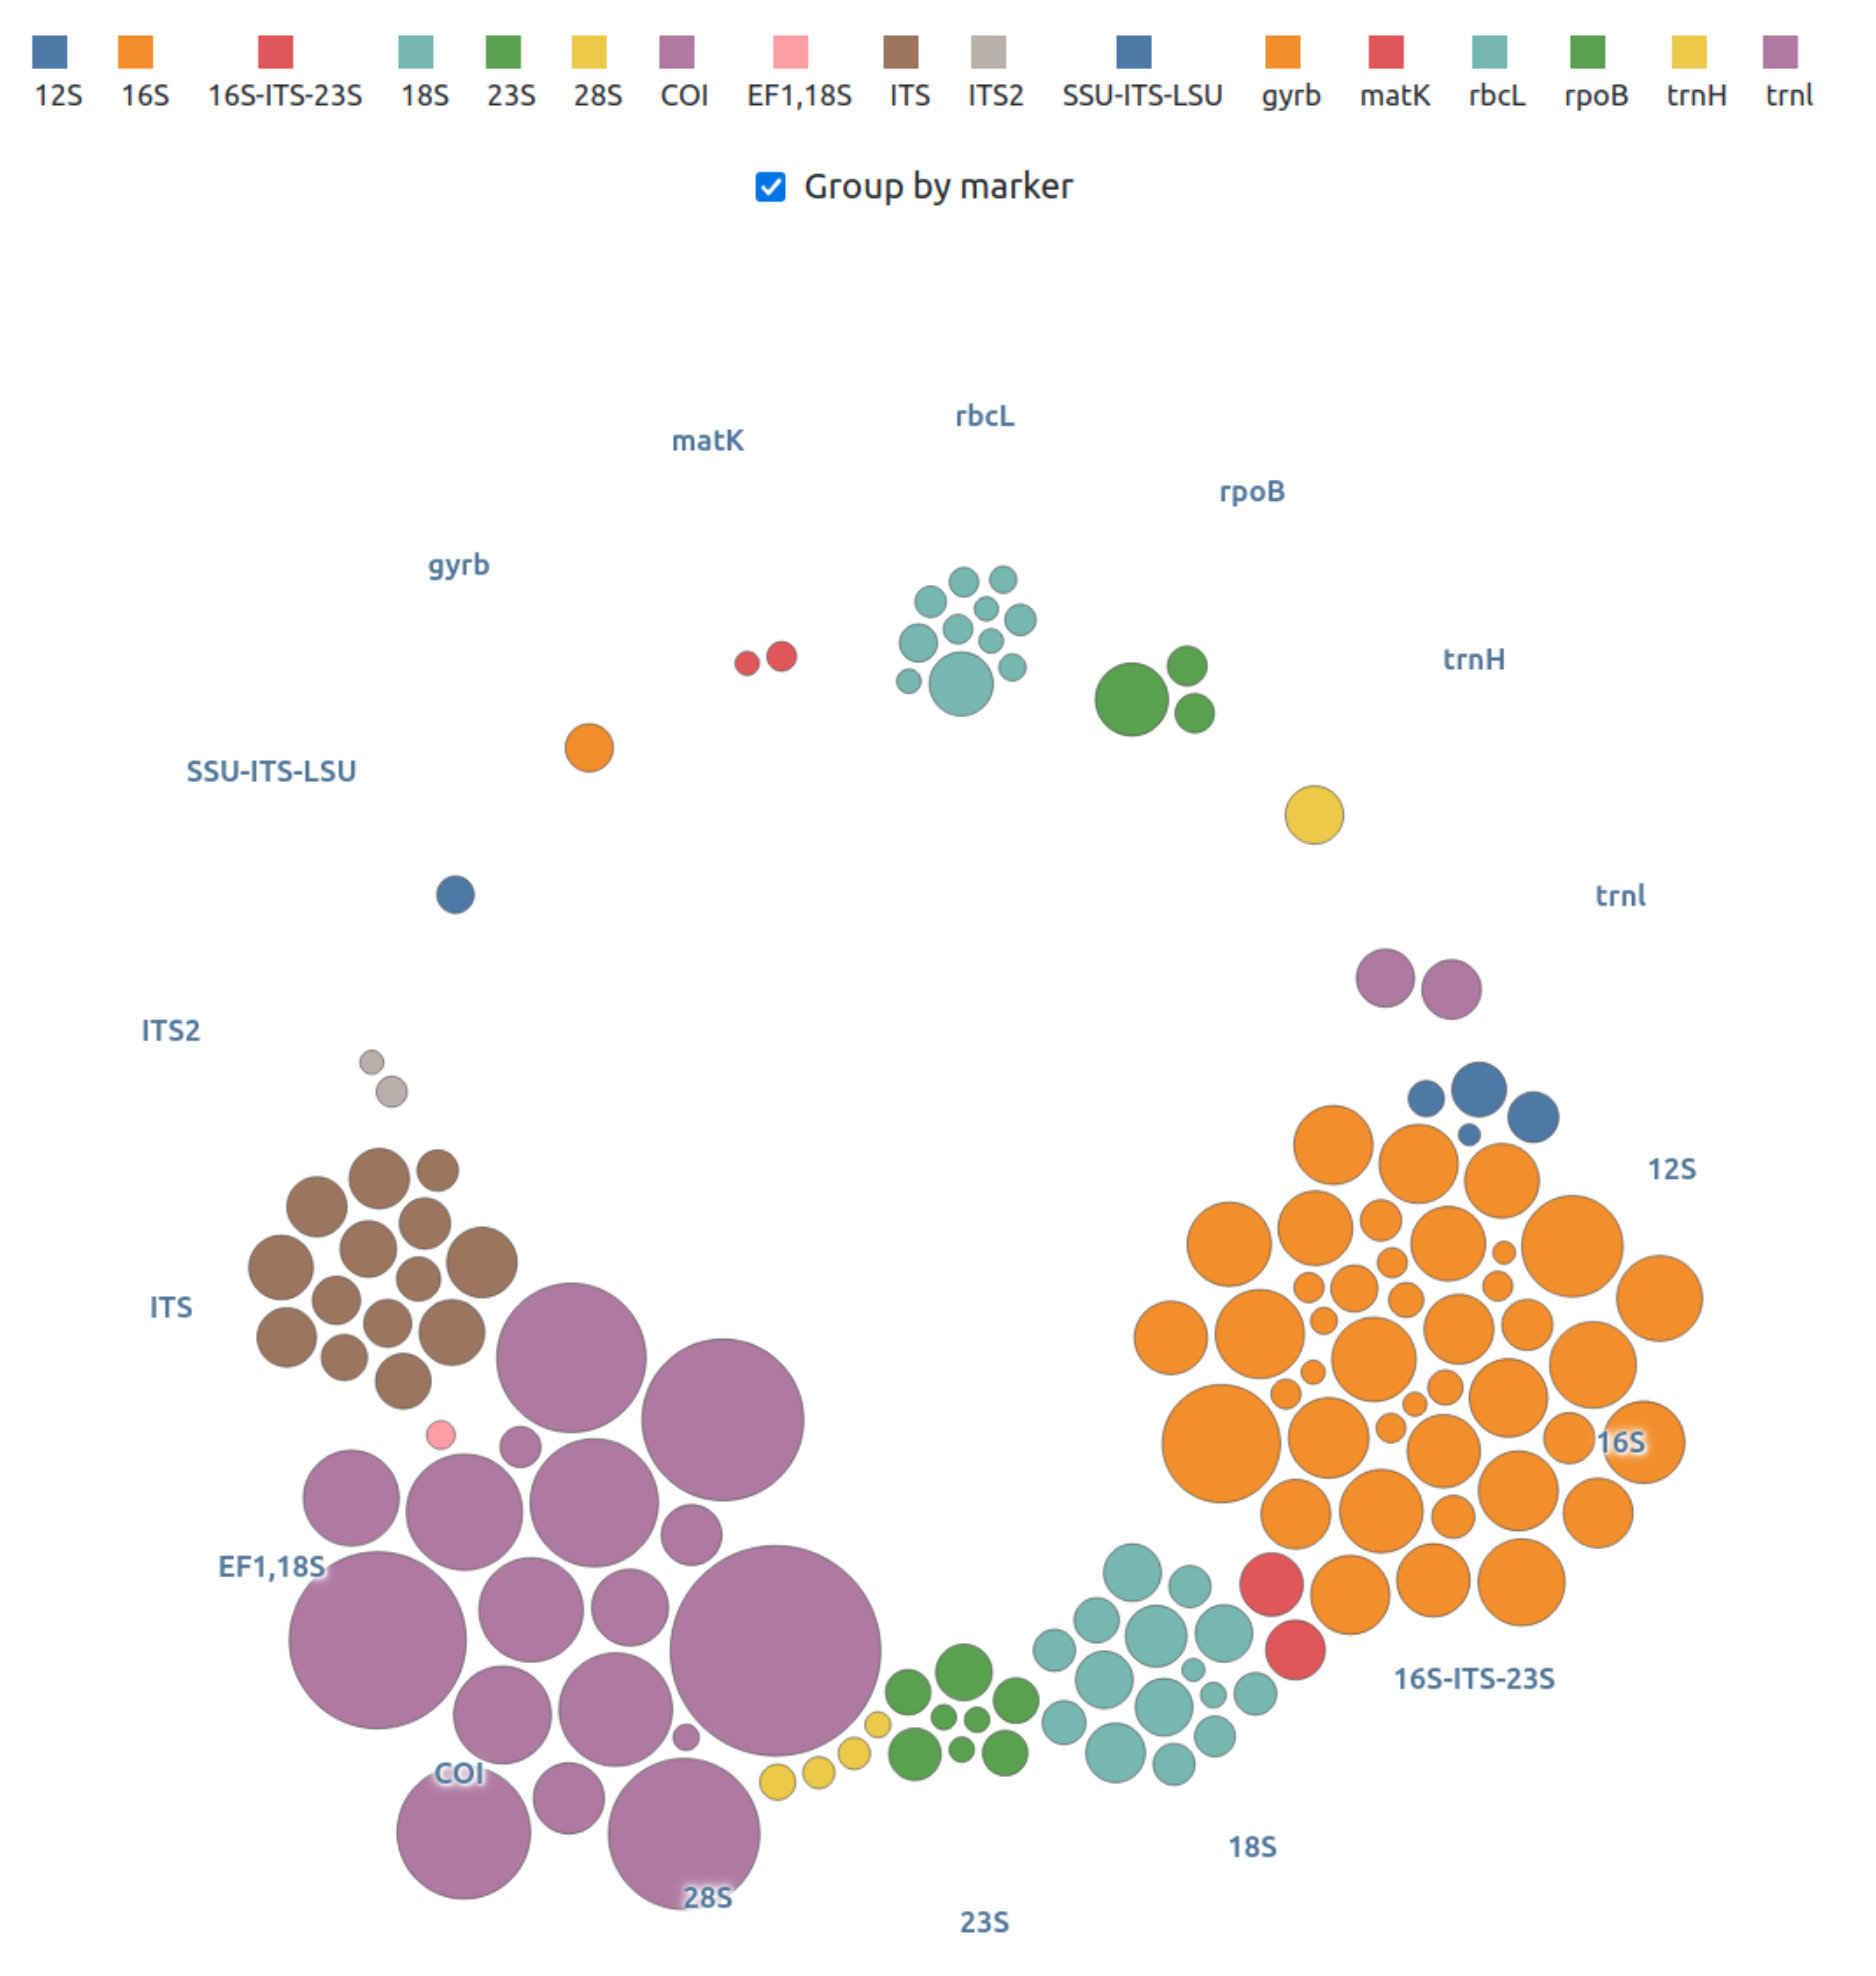
FROGS offers numerous databanks
FROGS articles
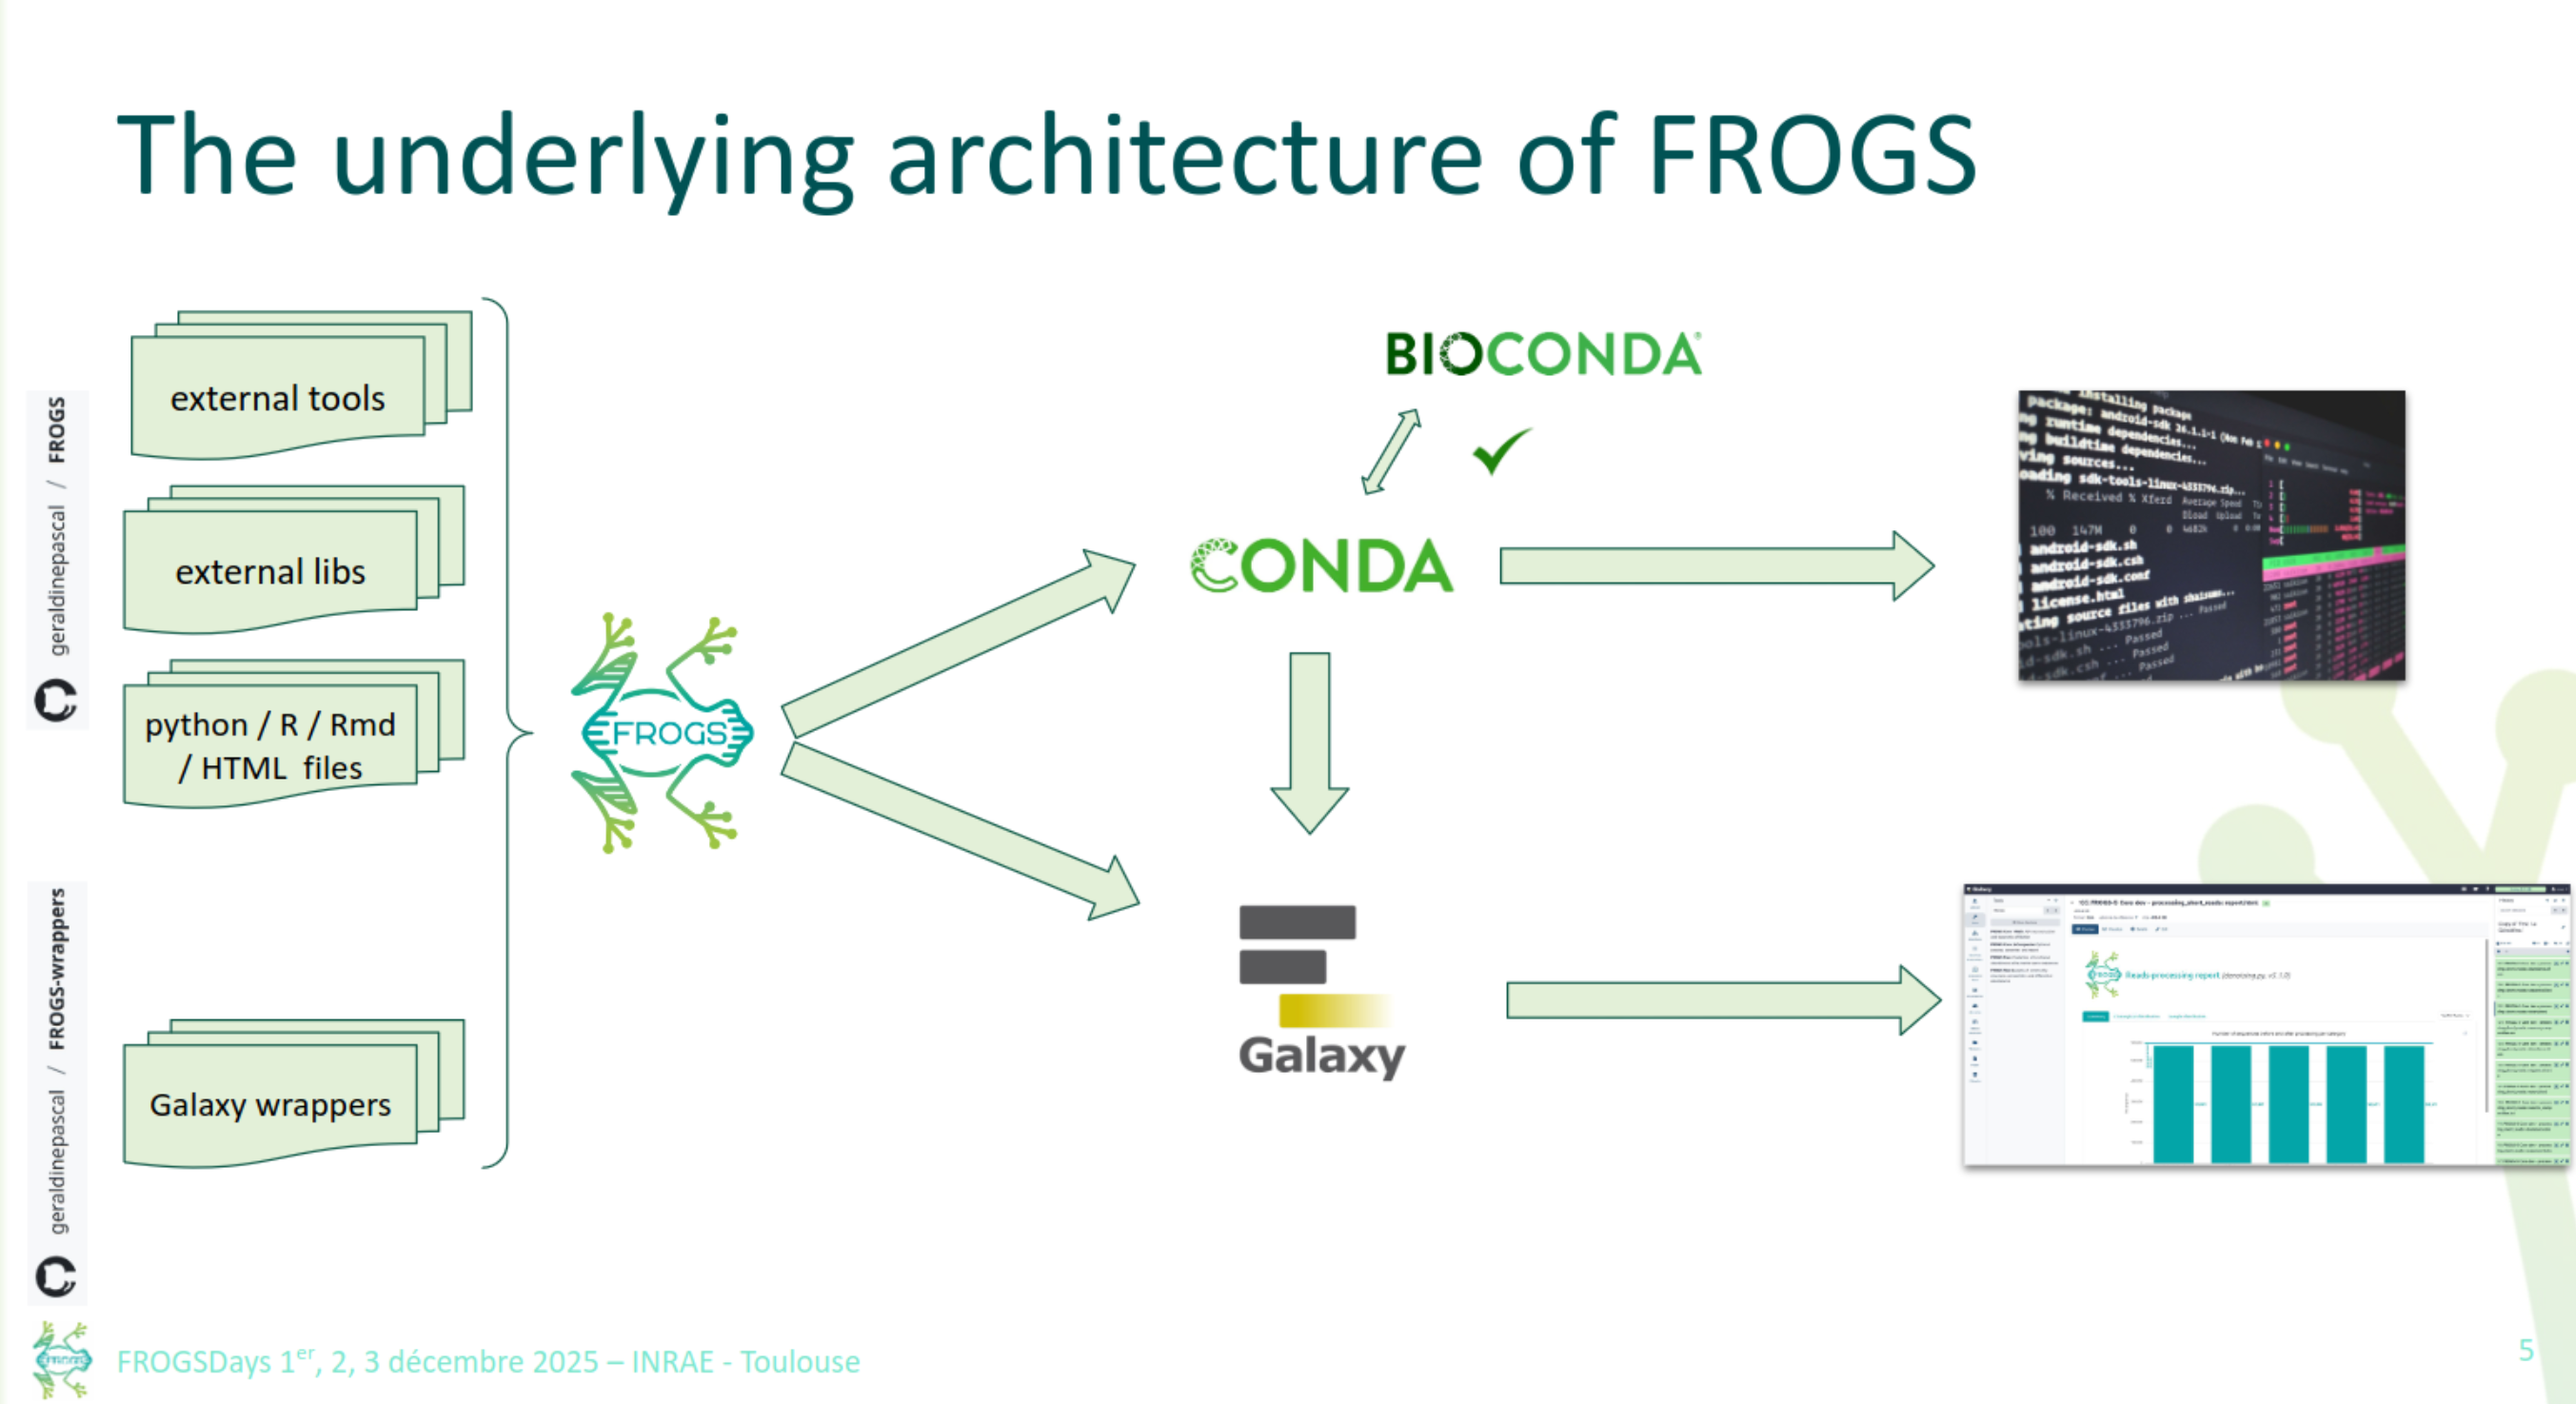
Understand FROGS
How to use FROGS
- Command line
remove_chimera.py
  --input-biom clustering.biom \
  --input-fasta clustering.fasta \
  --non-chimera remove_chimera.fasta \
  --out-abundance remove_chimera.biom \
  --summary remove_chimera.html
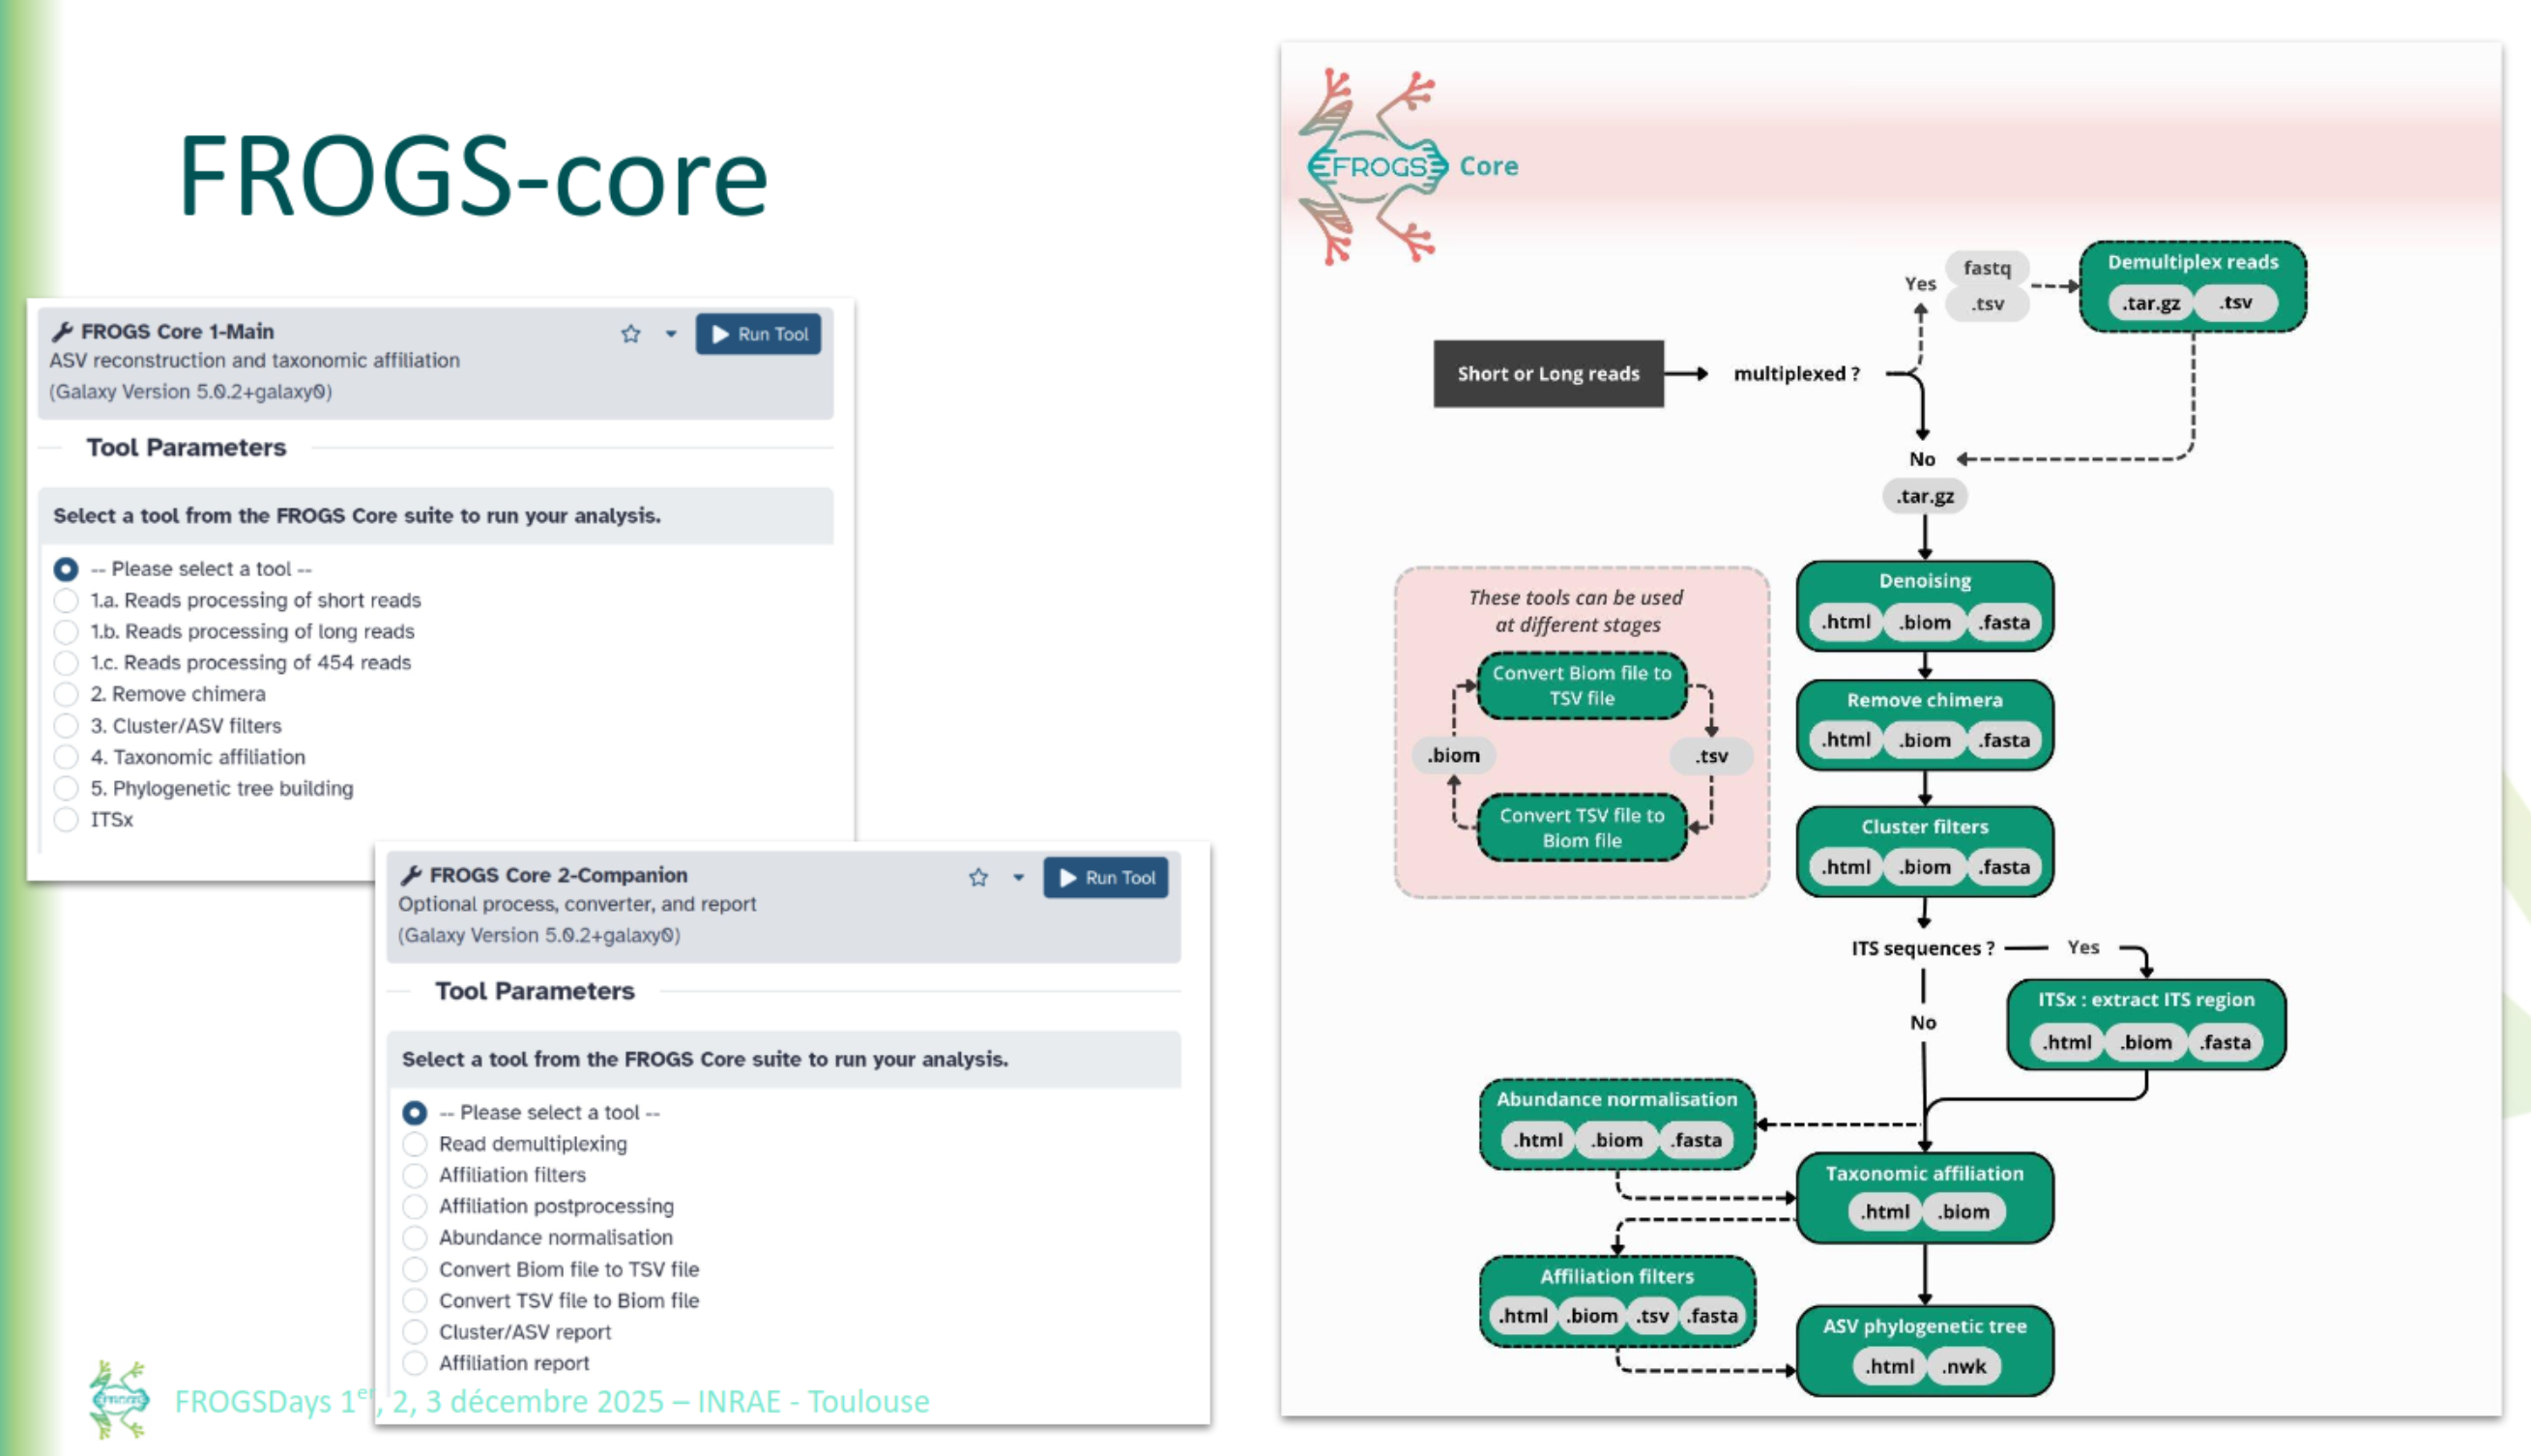
- Galaxy instances via web
![]()
FROGS Core
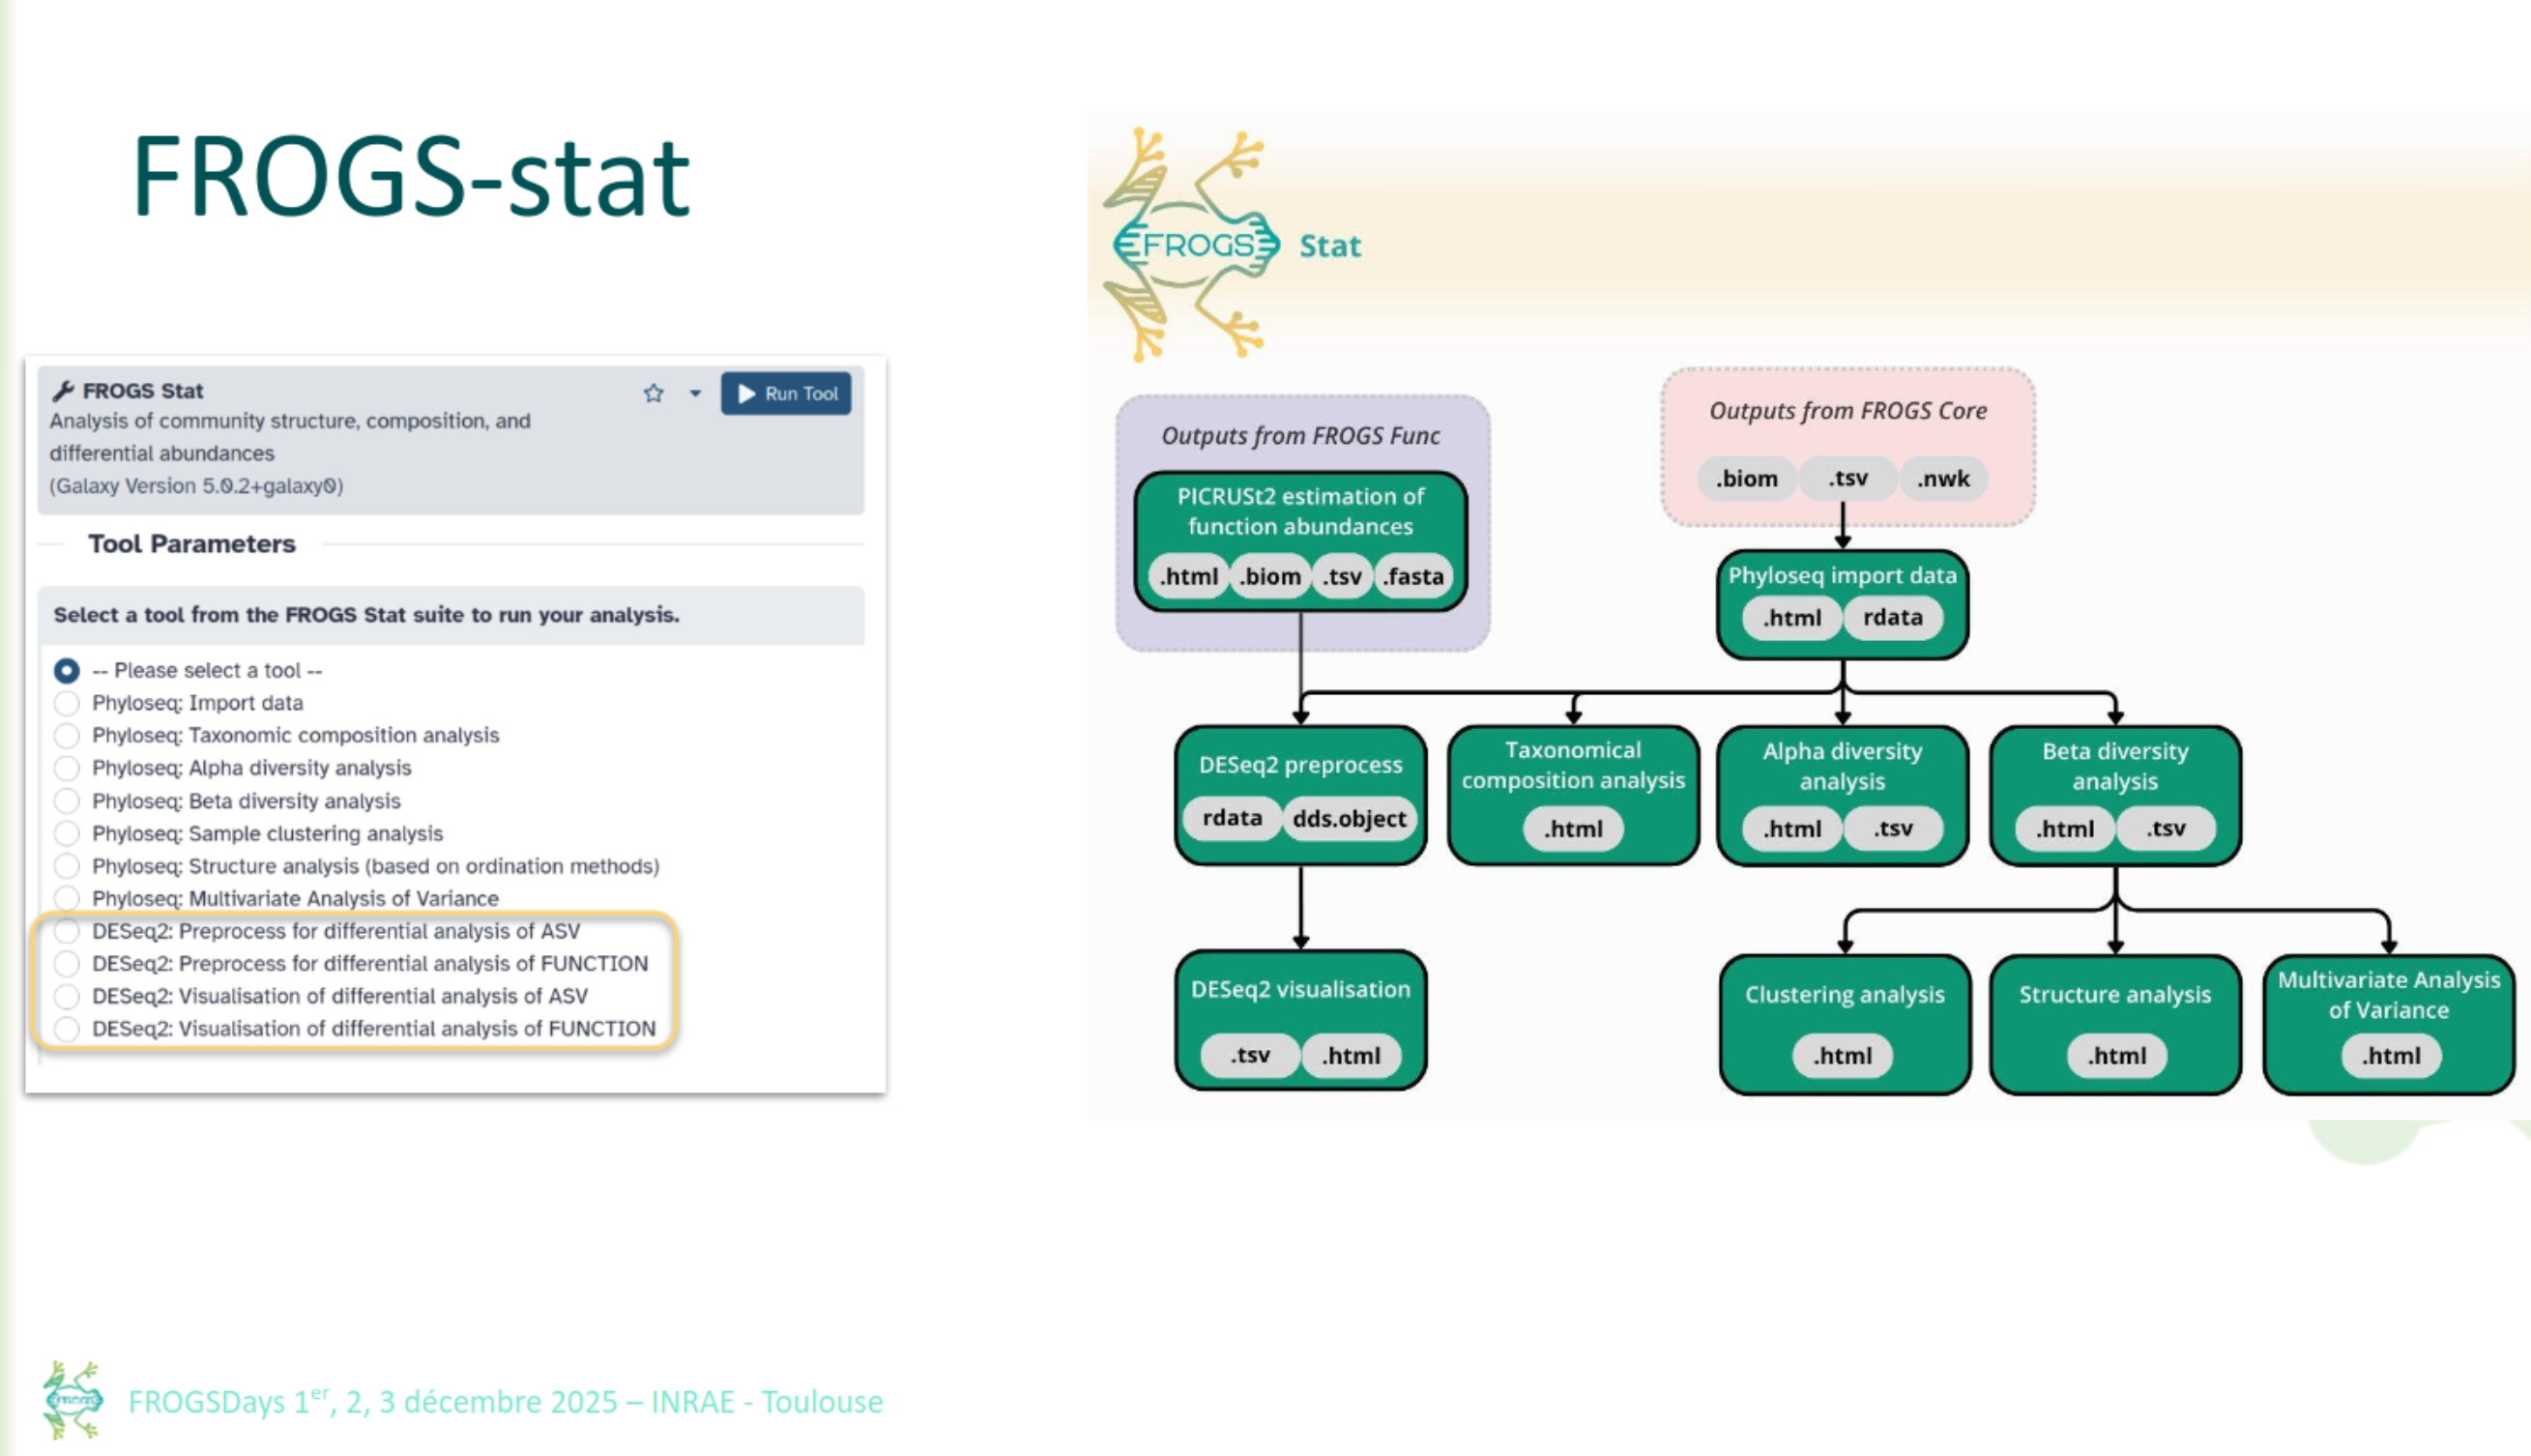
FROGS Stat
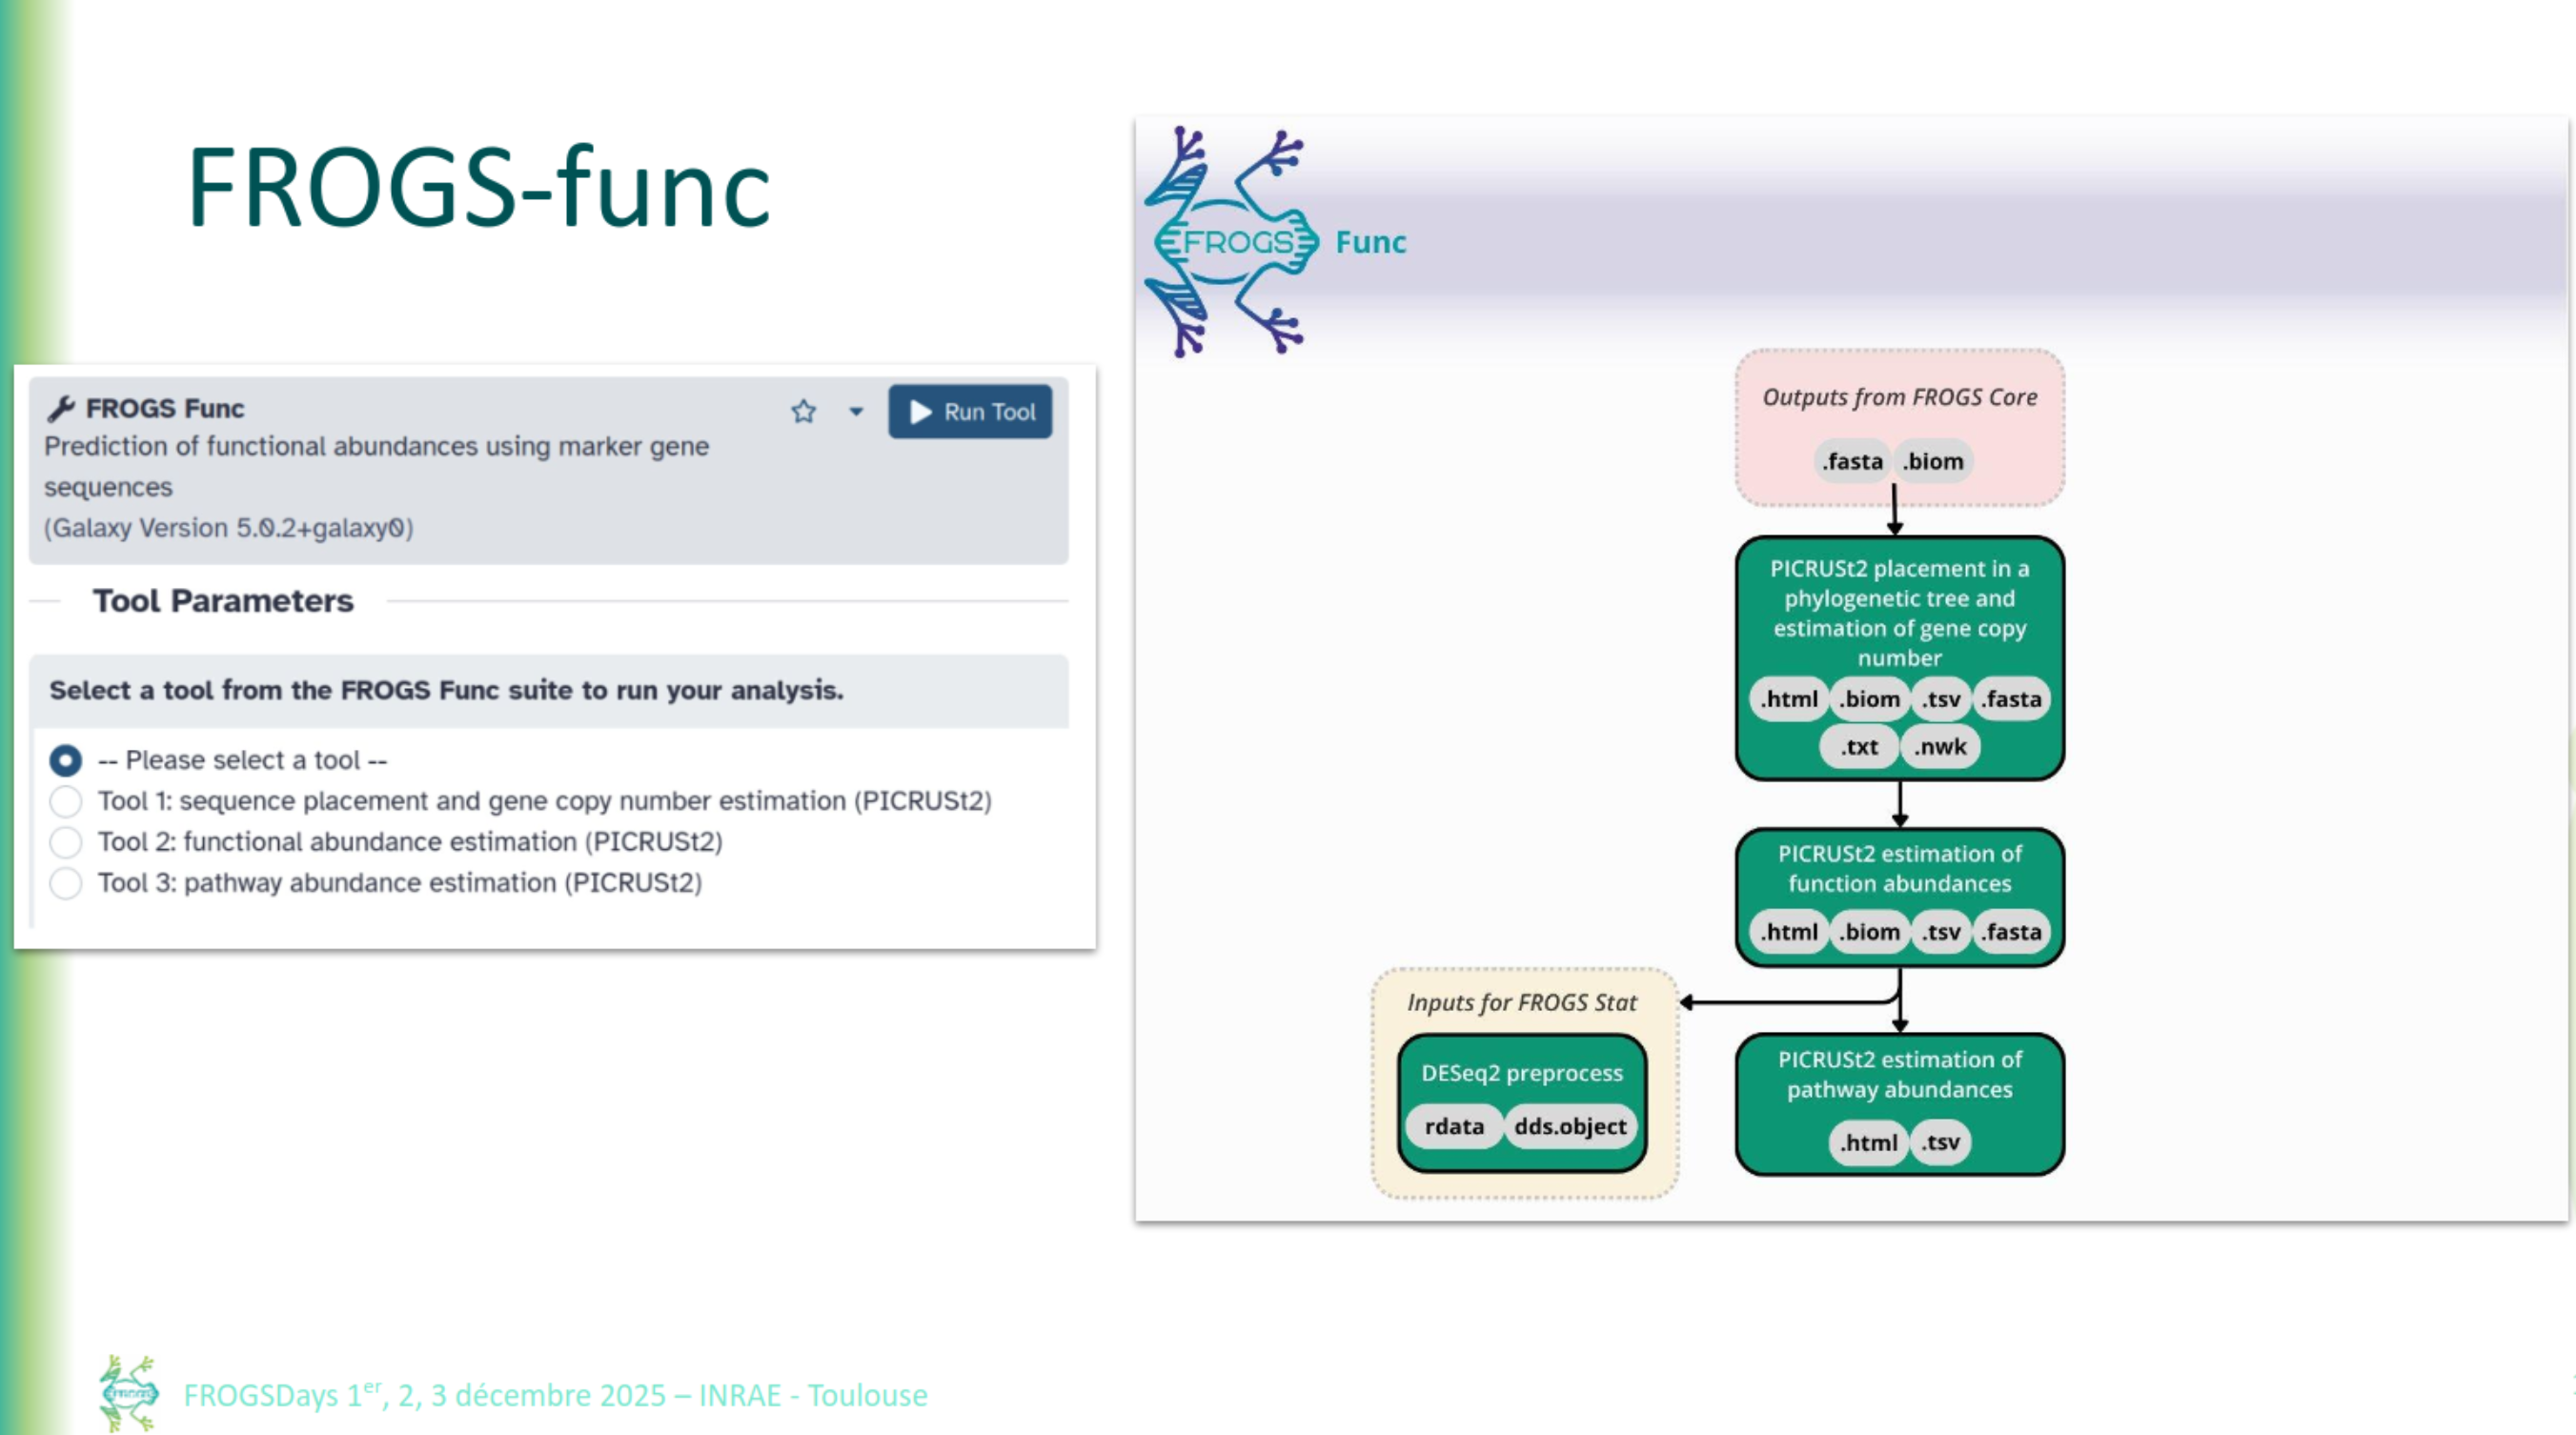
FROGS Func
FROGS docs and help
- Website: https://frogs.inrae.fr
- Github: https://github.com/geraldinepascal/FROGS.git
- Newsletter: subscription request at frogs-support@inrae.fr
- Need help
- frogs-support@inrae.fr for generic questions
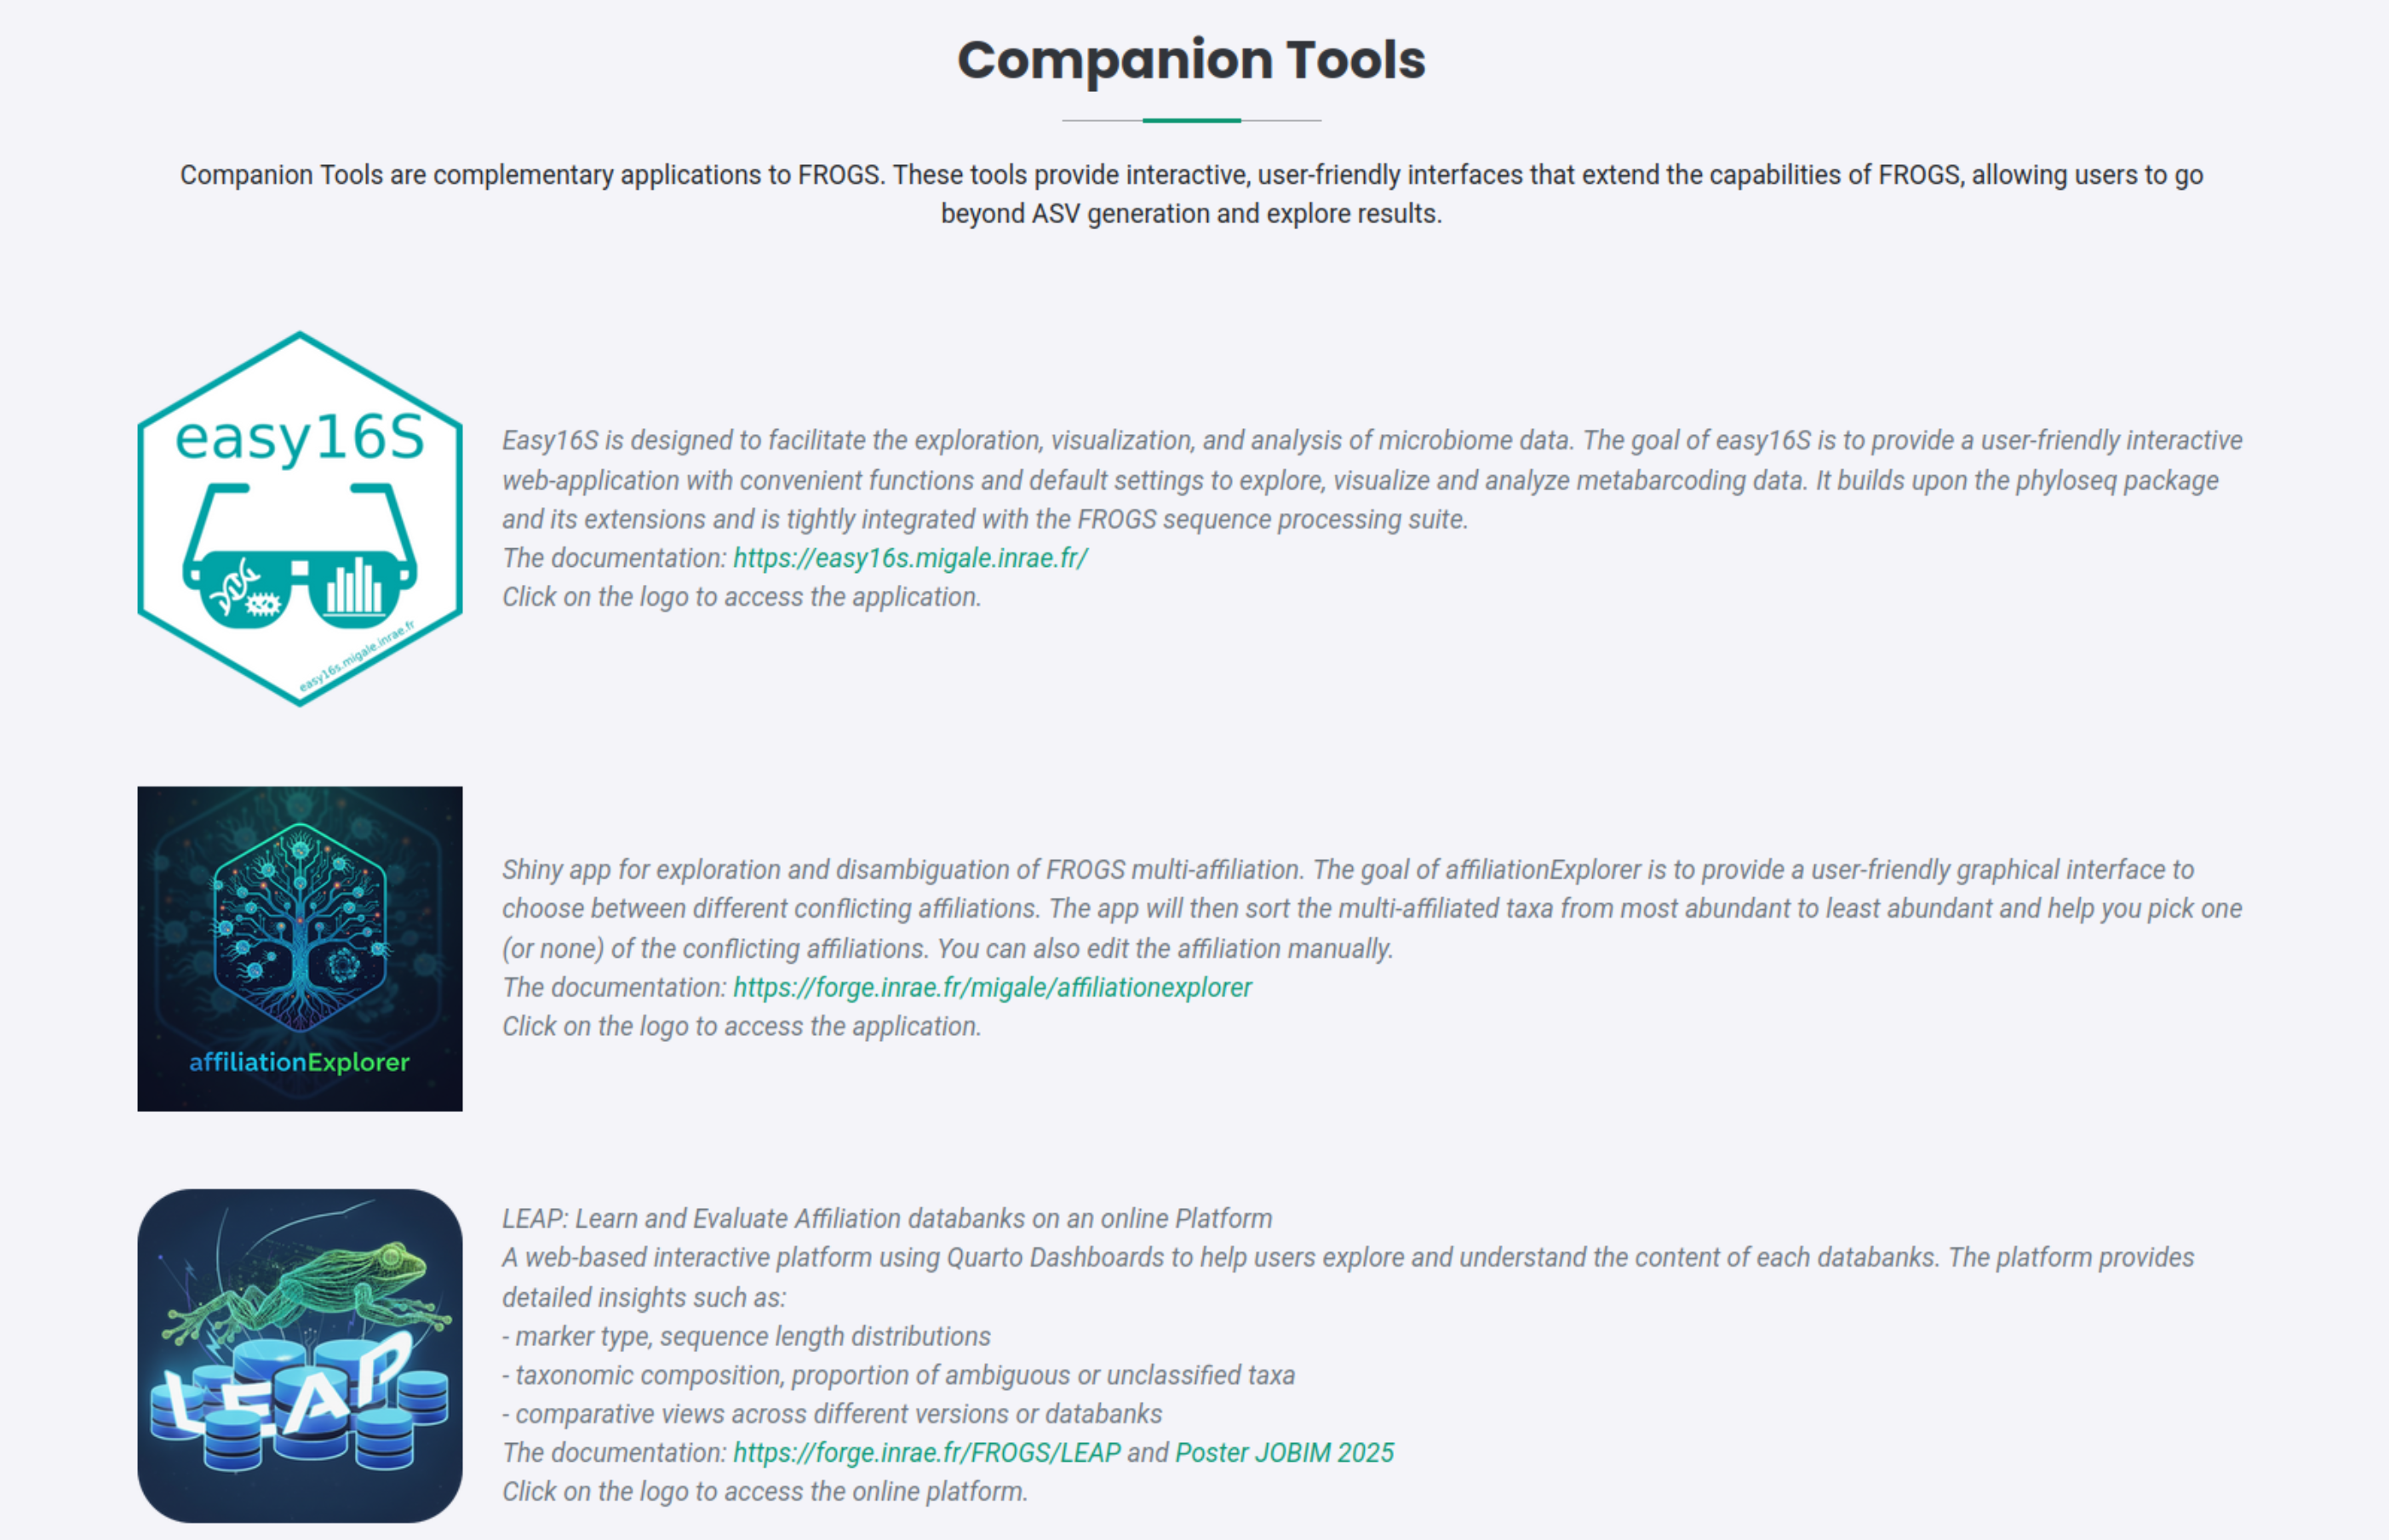
FROGS companion tools
Quality score encoding
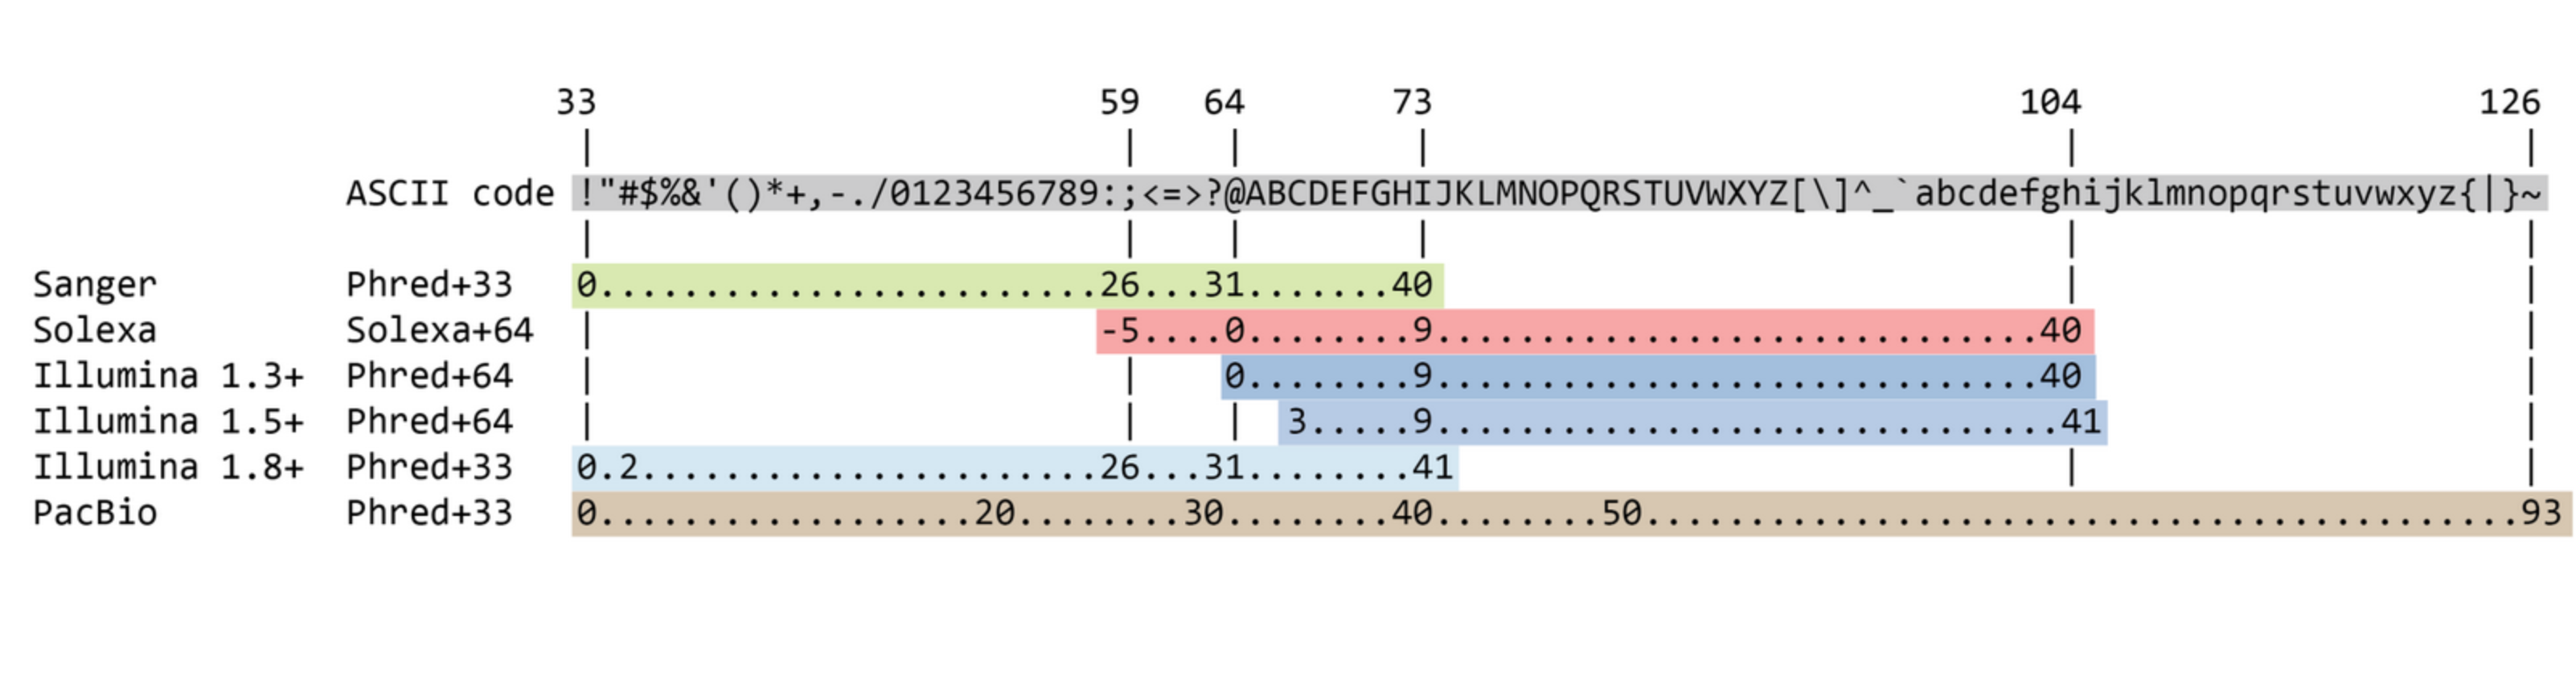
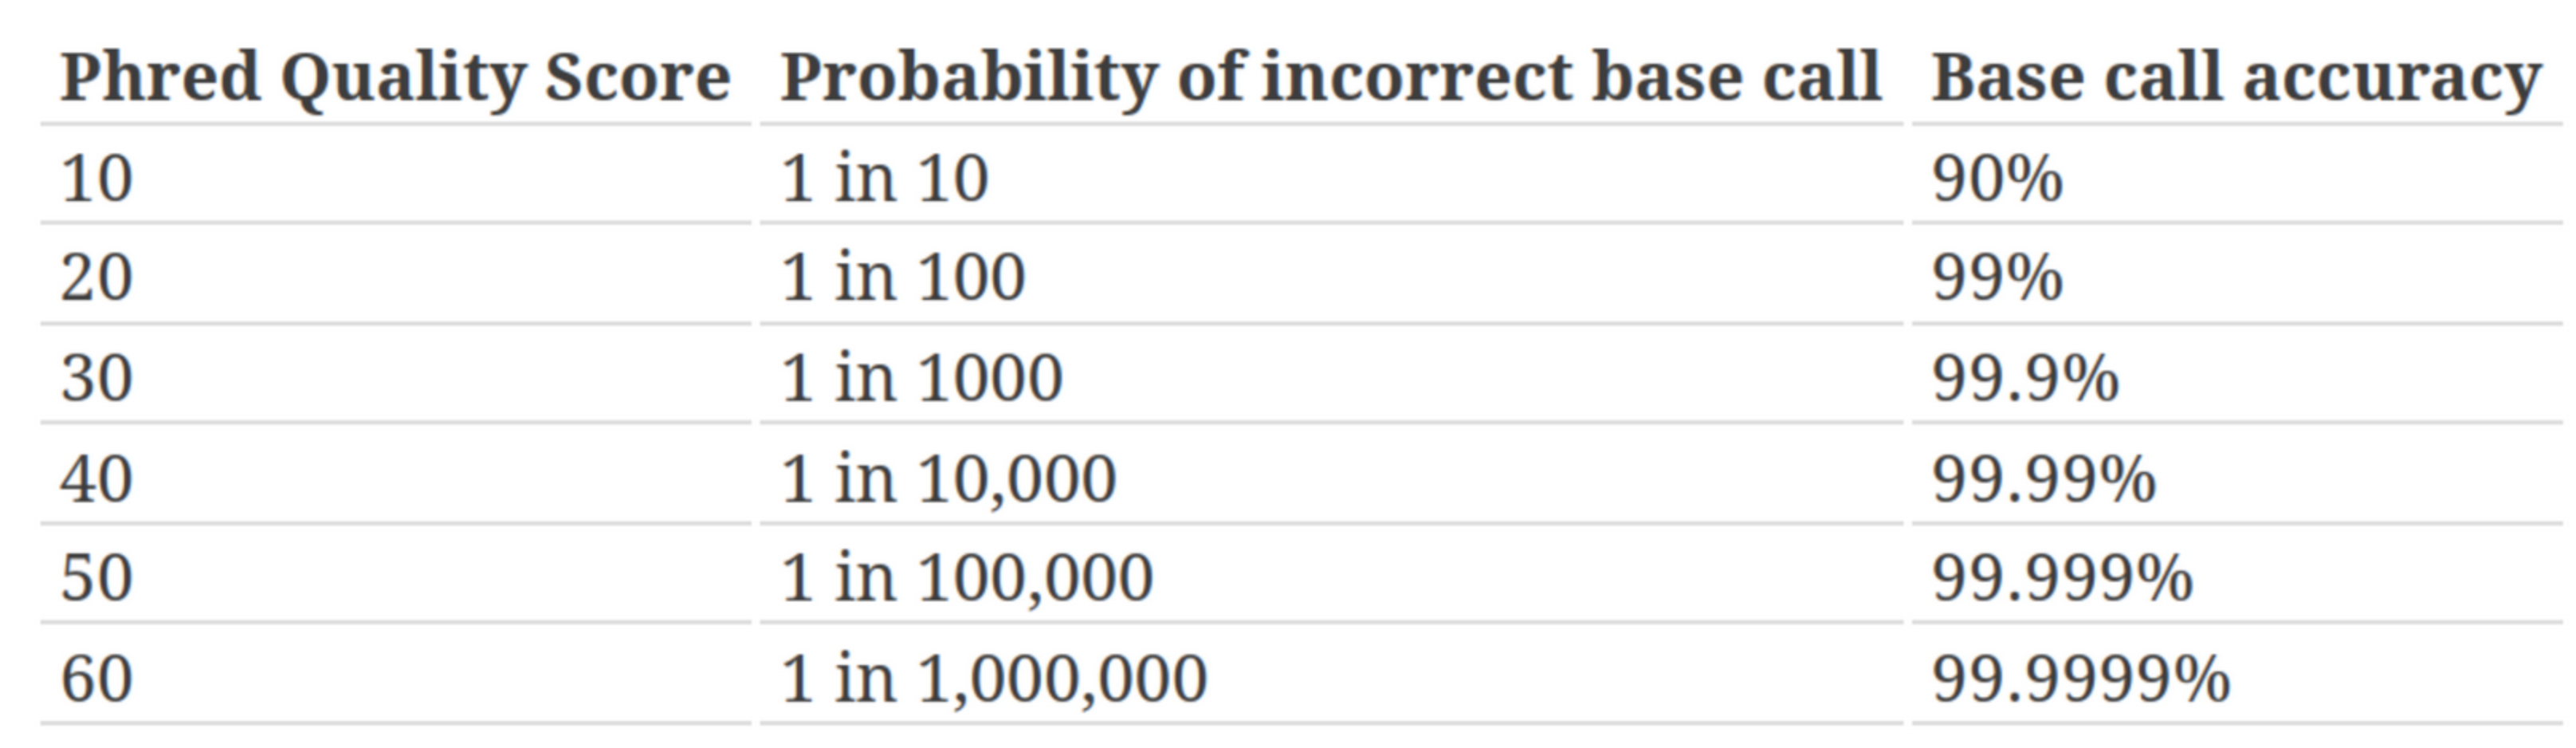
Quality score
Measure of the quality of the identification of the nucleobases generated by automated DNA sequencing
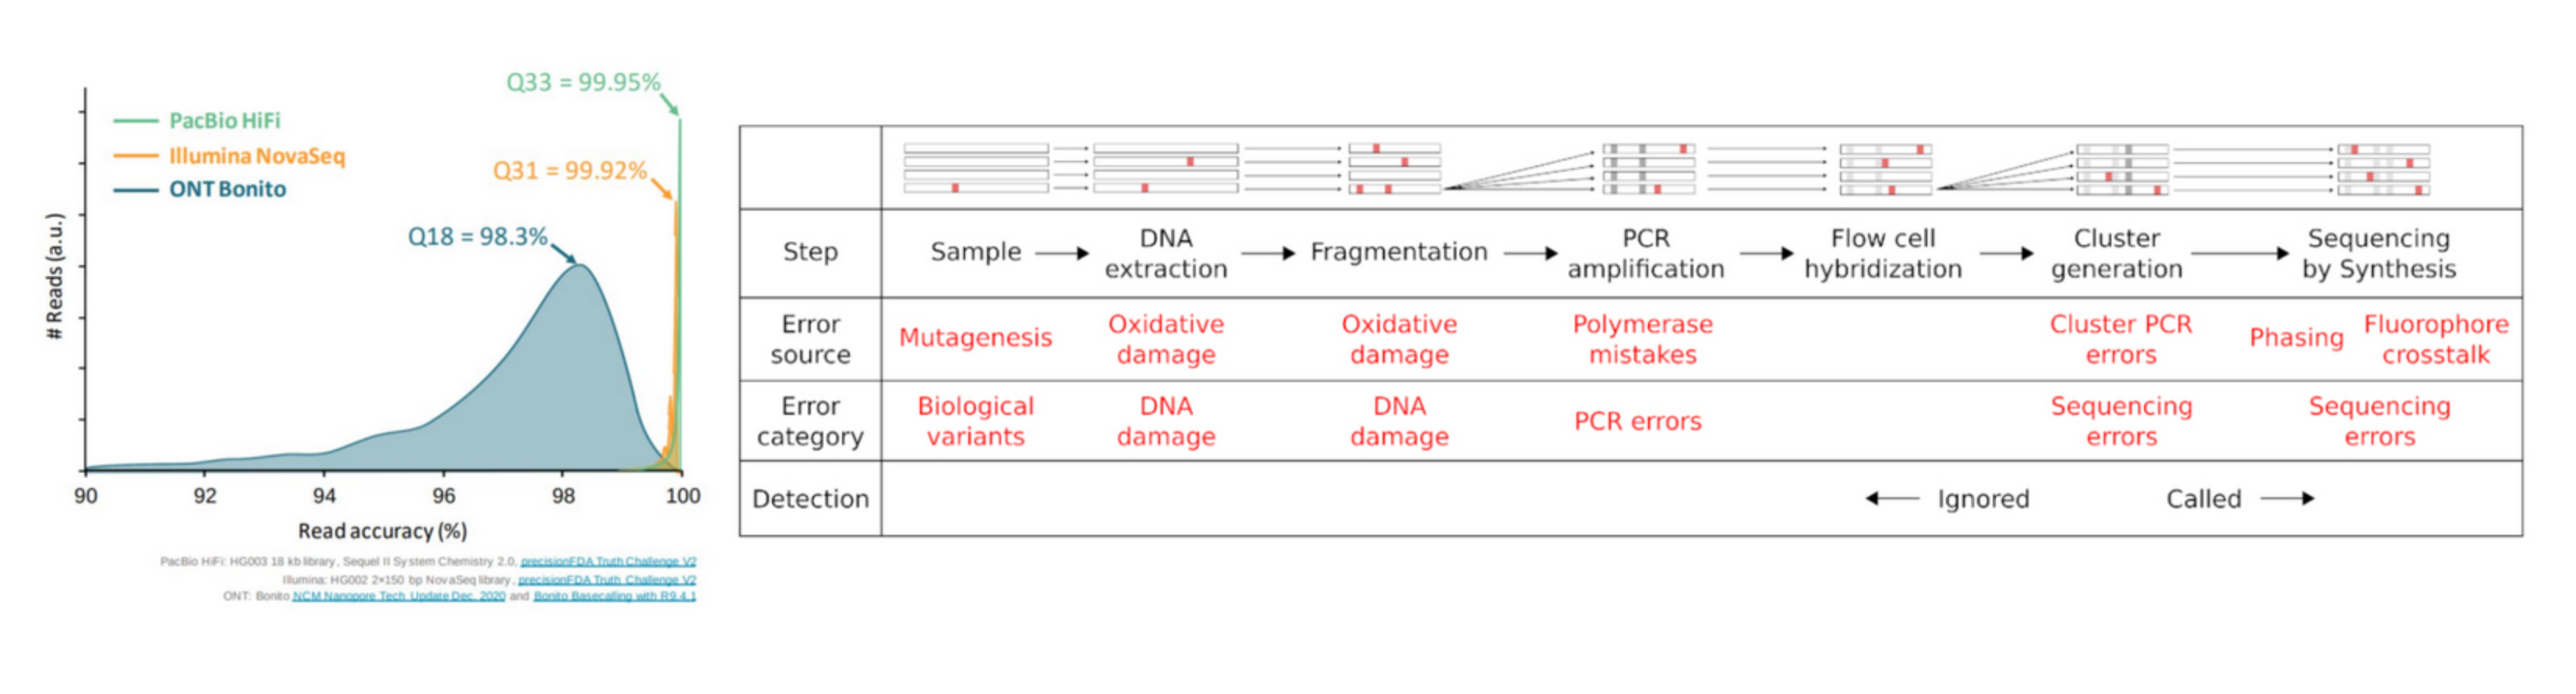
Reads are not perfect
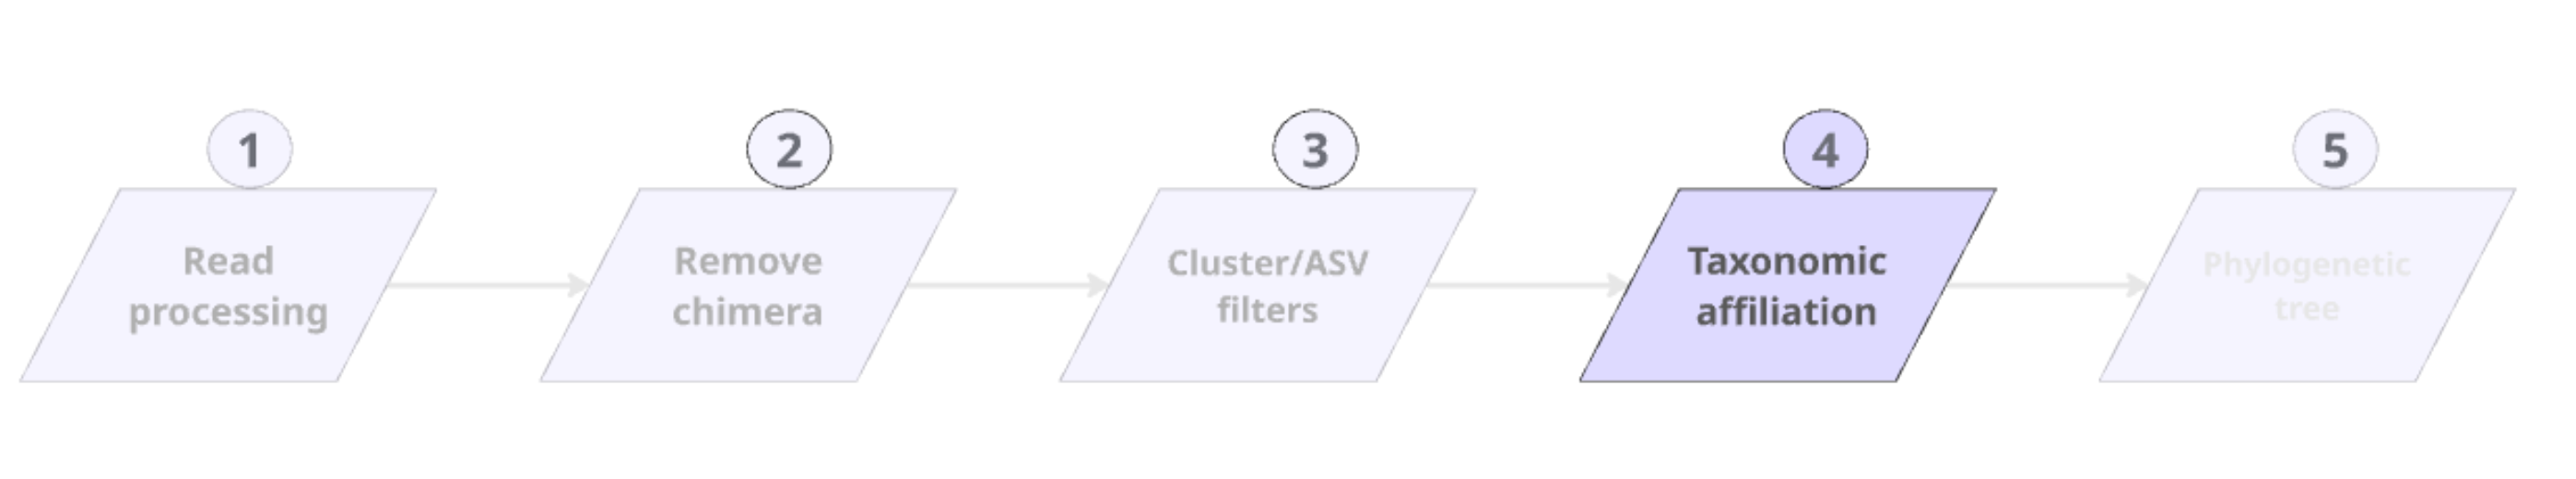
FROGS workflow
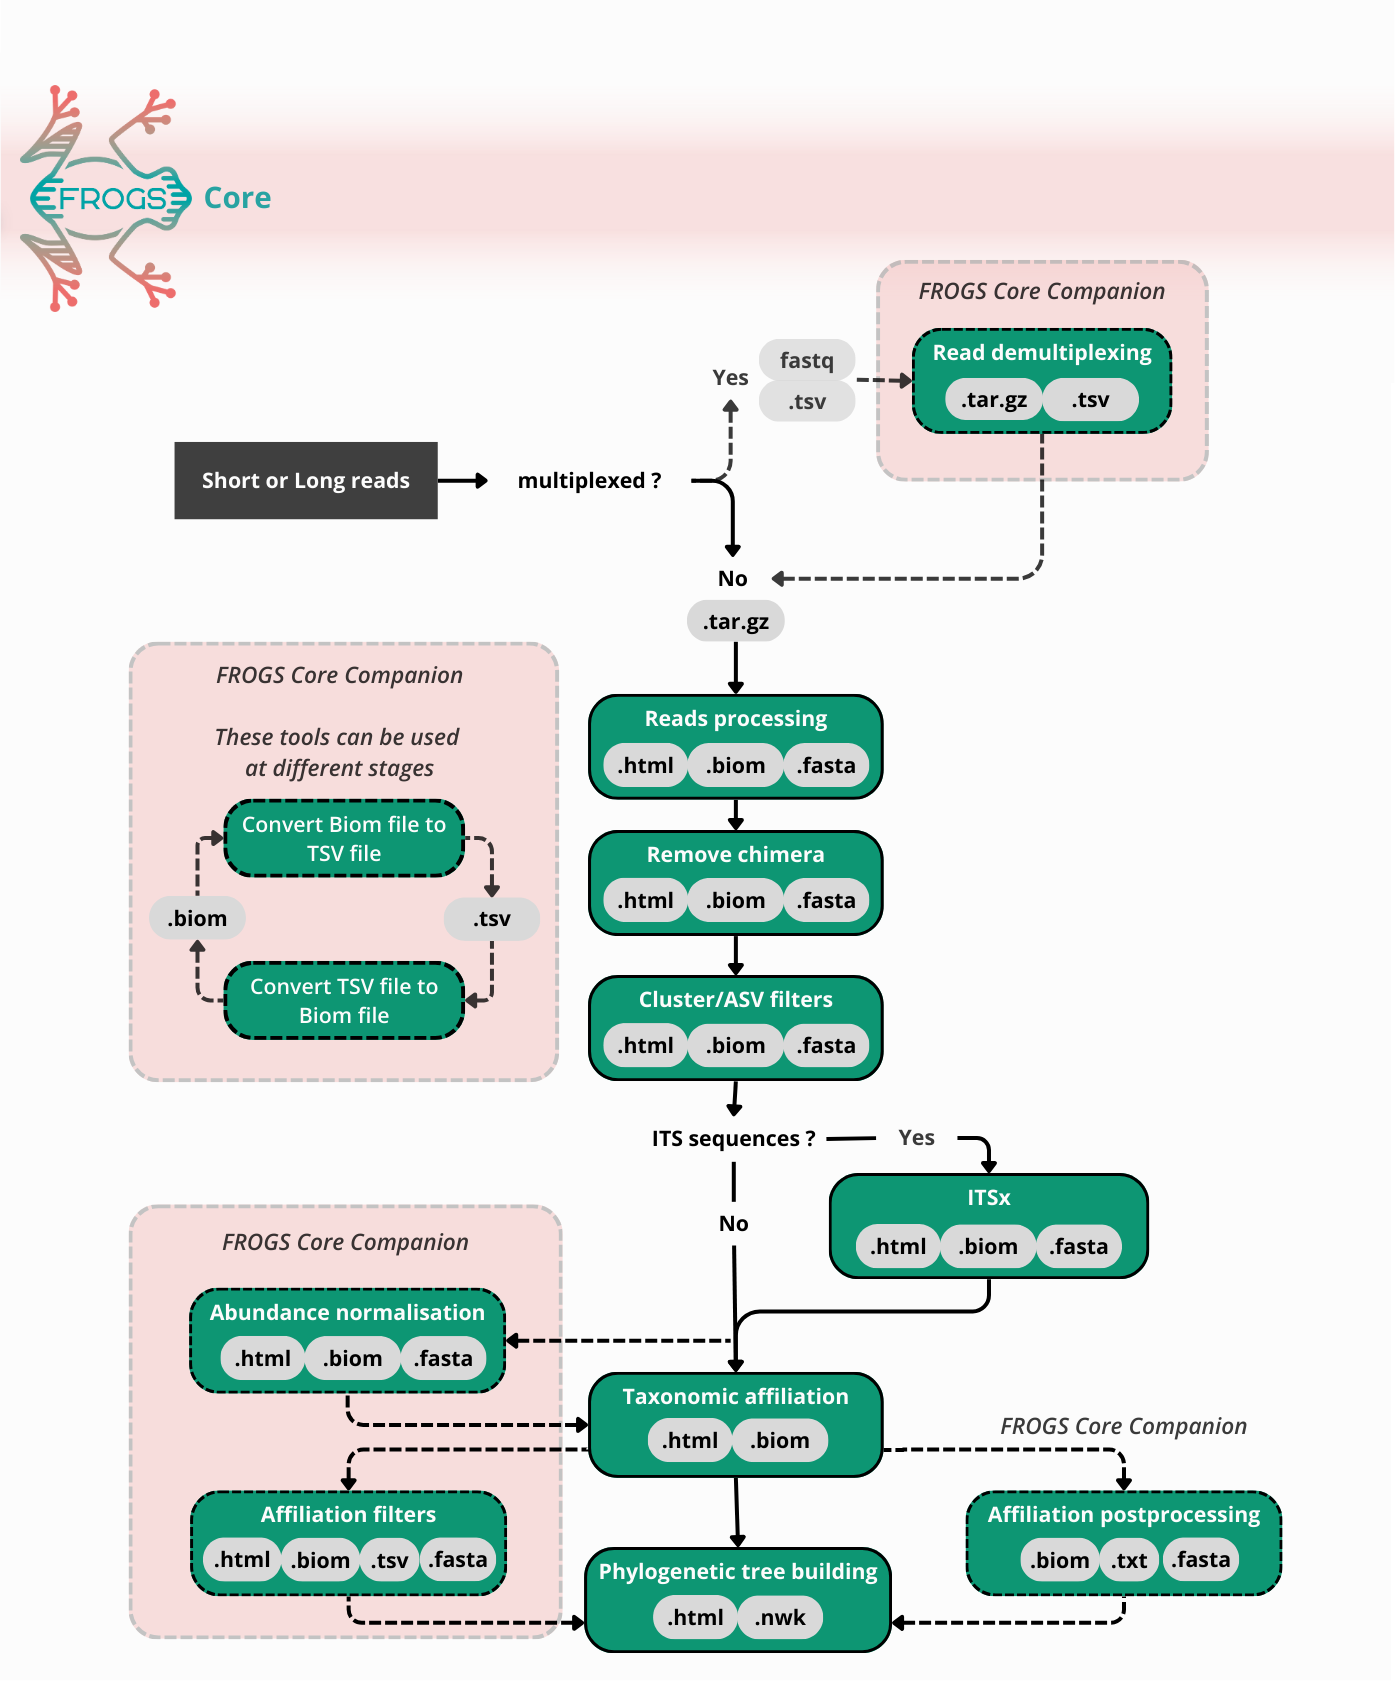
FROGS workflow
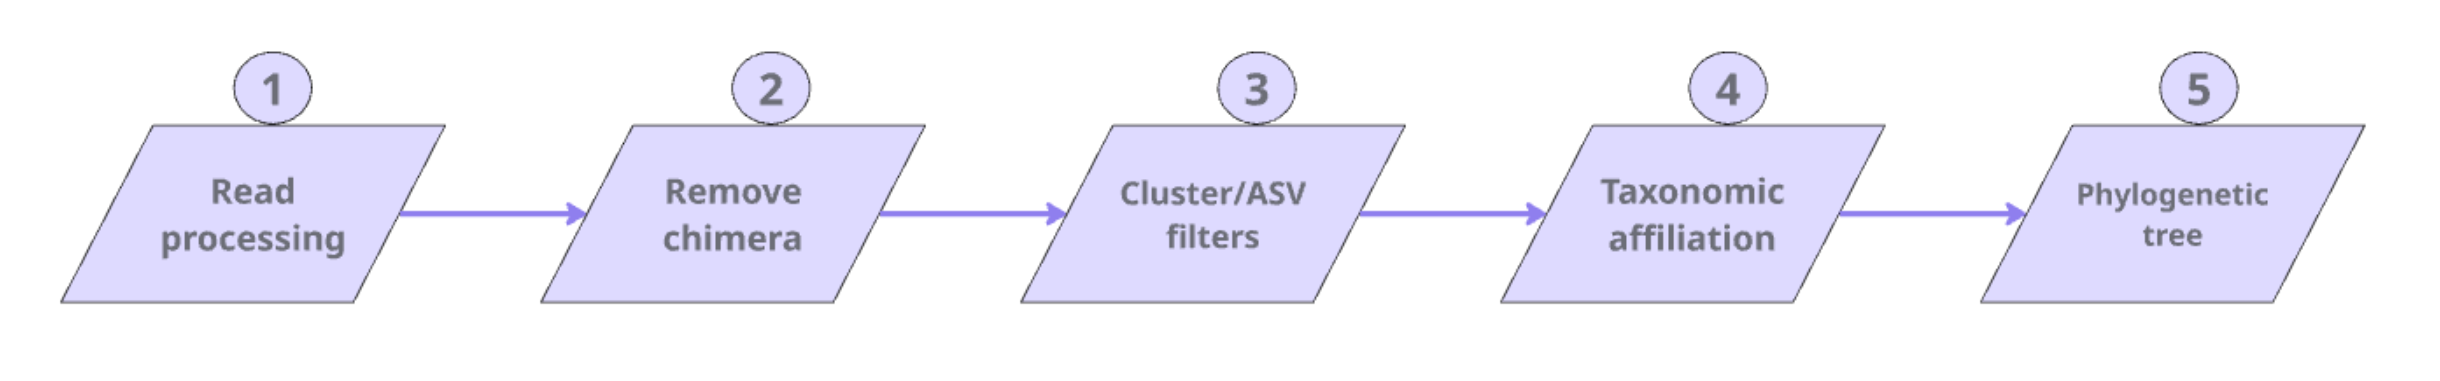
FROGS Read processing
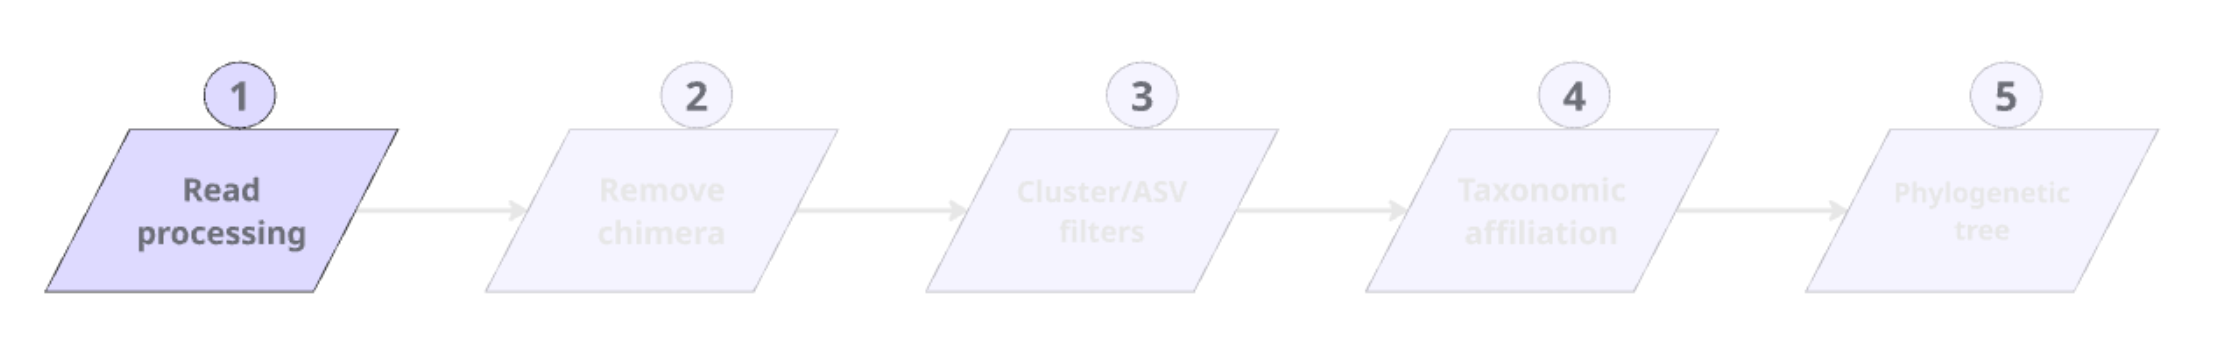
FROGS Read processing
FROGS Read processing with swarm
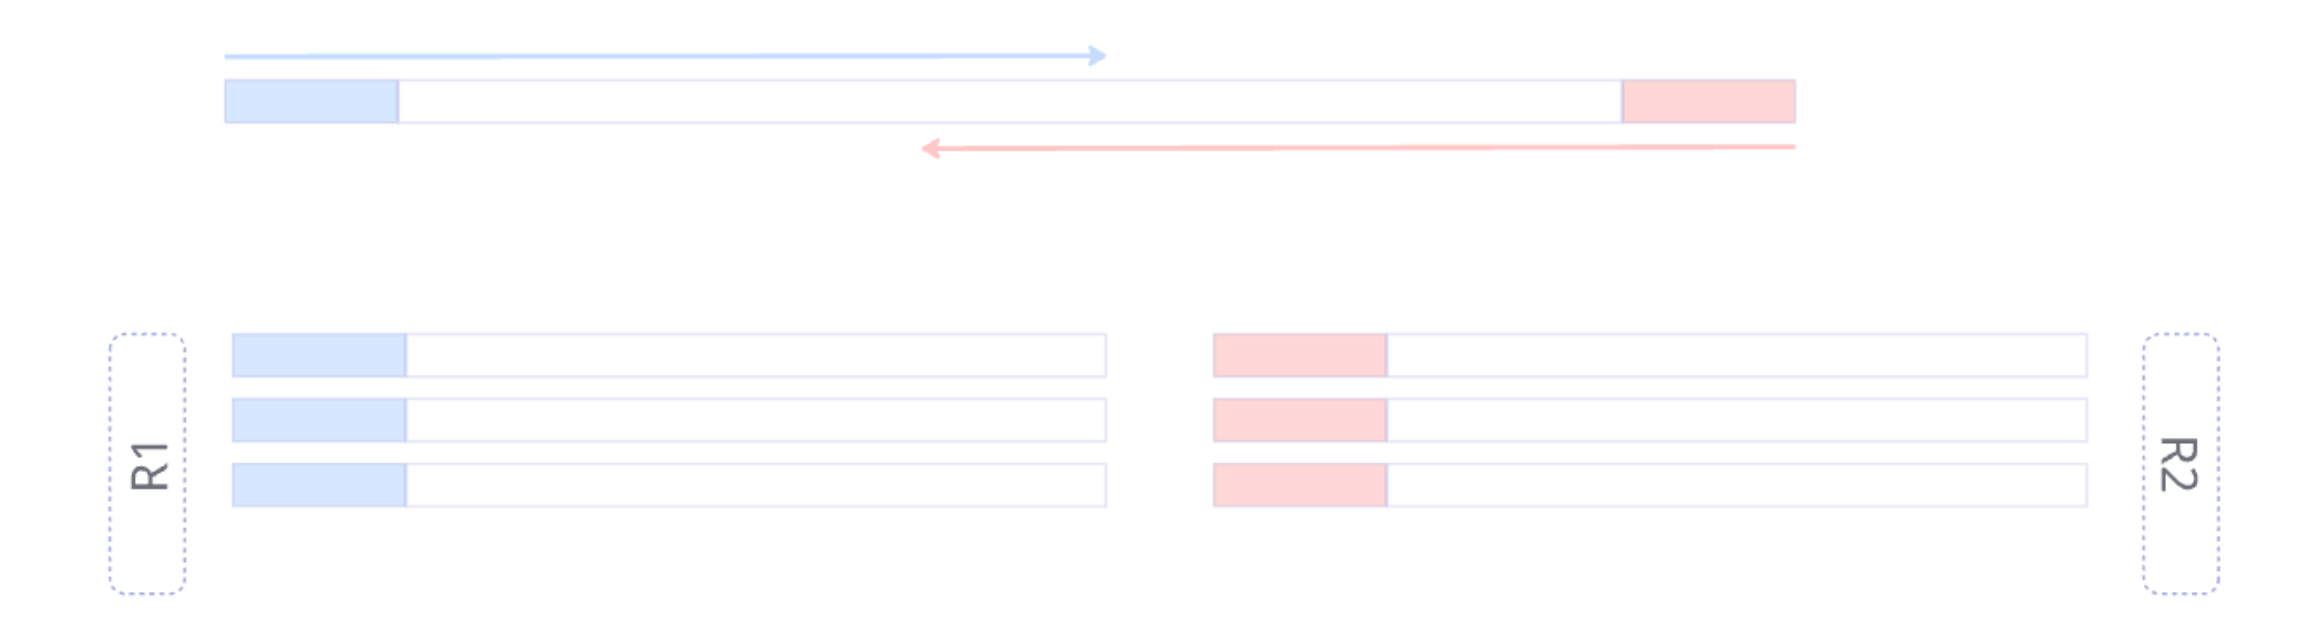

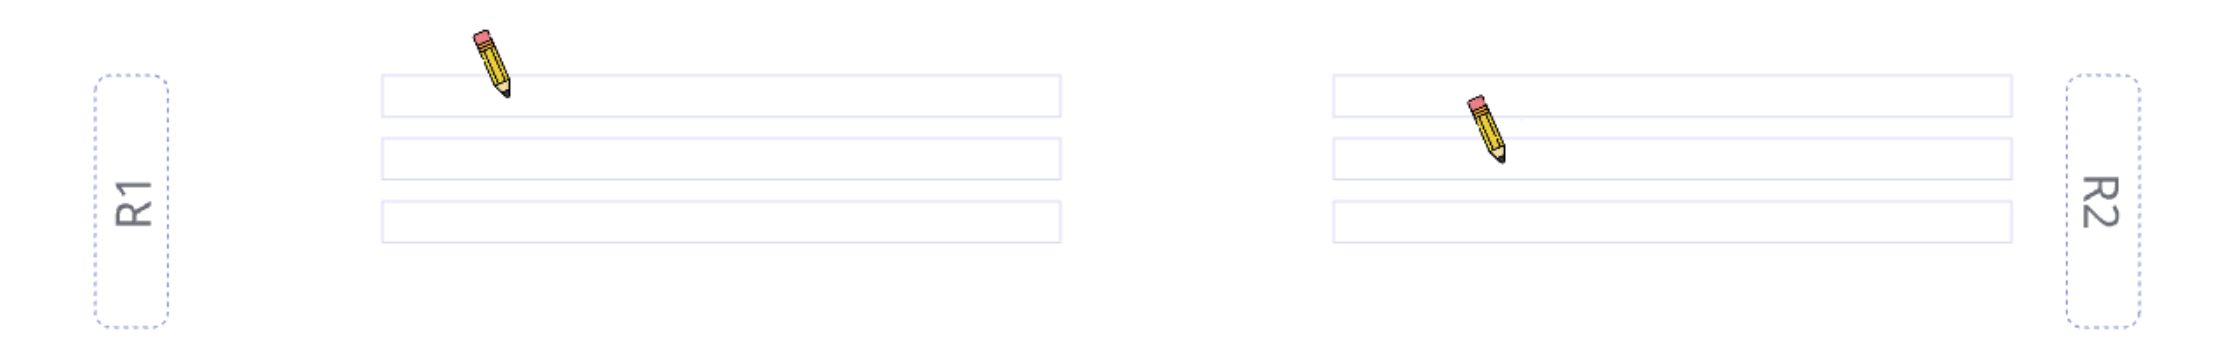
- R1 and R2 reads are together
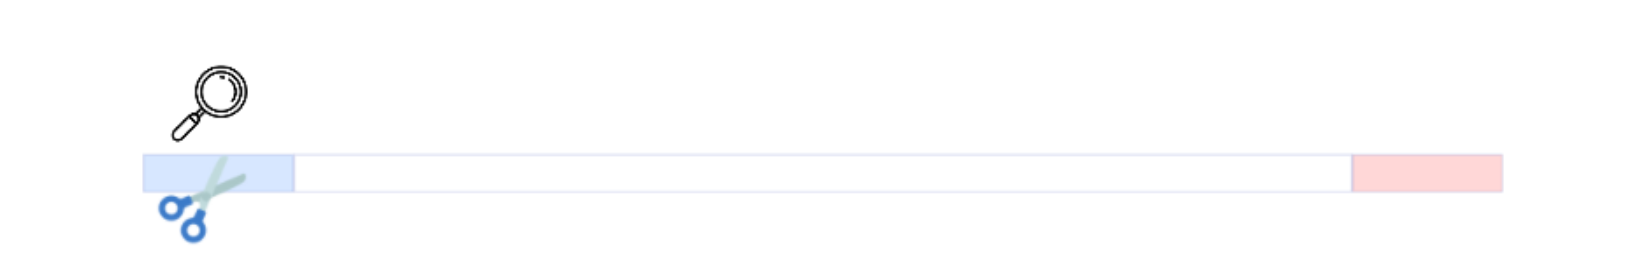
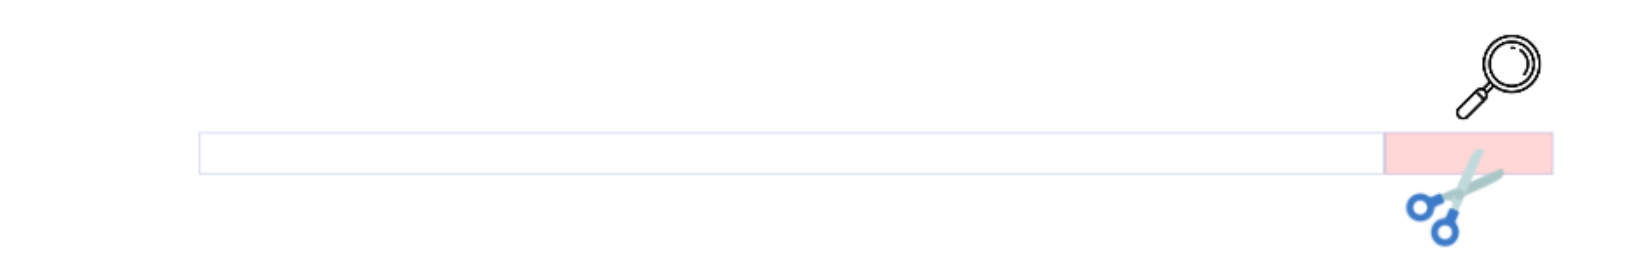
- Find 5’ primer and remove it
- Find 3’ primer and remove it
- Remove sequences with N’s inside
FROGS Read processing with swarm


- Remove shortest and longest sequences
- Remove sequences with N’s inside
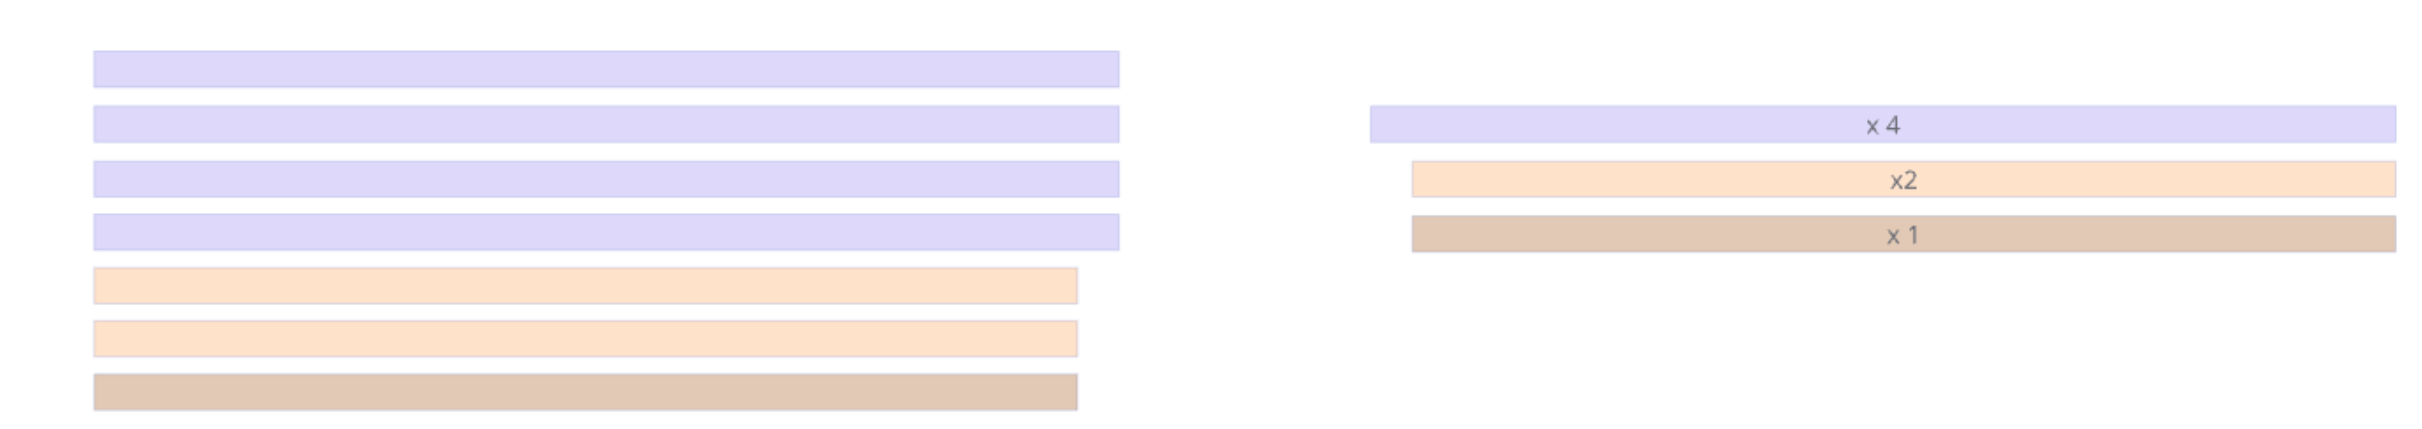
- Dereplication
- Clustering with swarm
FROGS Read processing with DADA2


- R1 and R2 reads are together
- Find 5’ primer and remove it
- Find 3’ primer and remove it
- Remove reads with N’s inside
FROGS Read processing with DADA2

- Correct sequencing errors
- Merge R1 and R2
- Remove shortest and longest sequences
- Dereplication
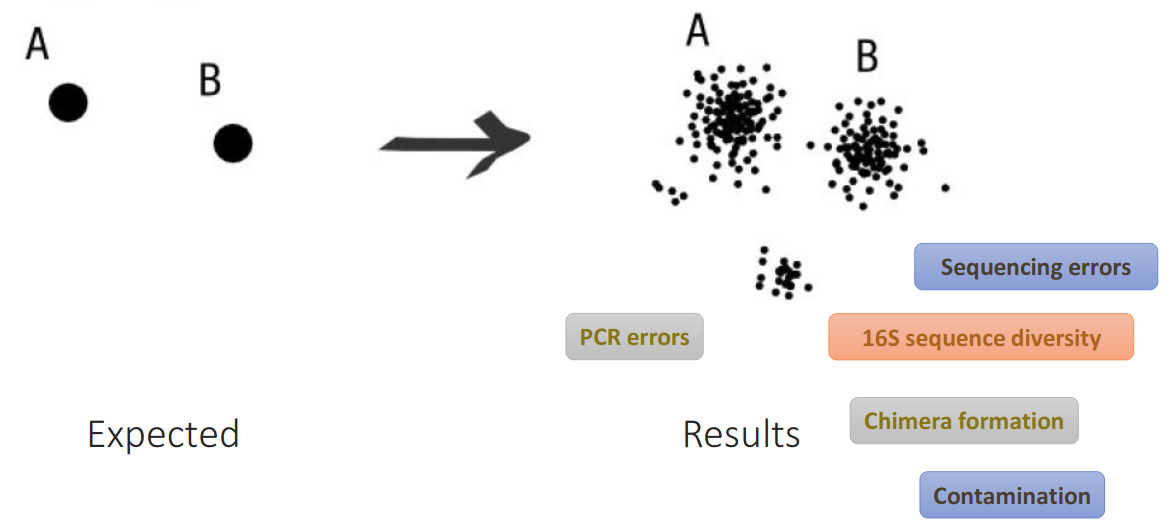
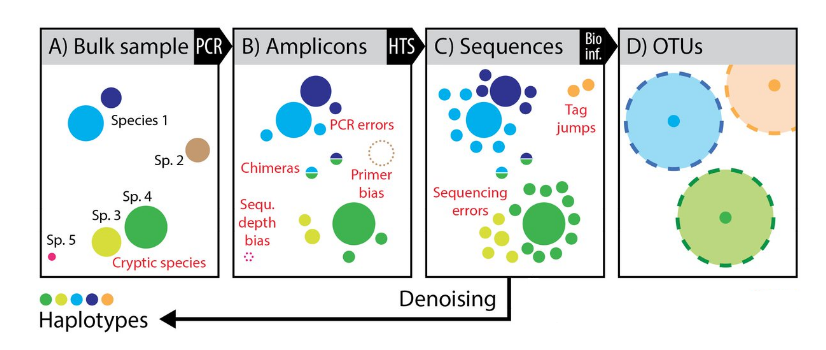
Sequencing data are noised
OTU paradigm
- Operational Taxonomic Unit
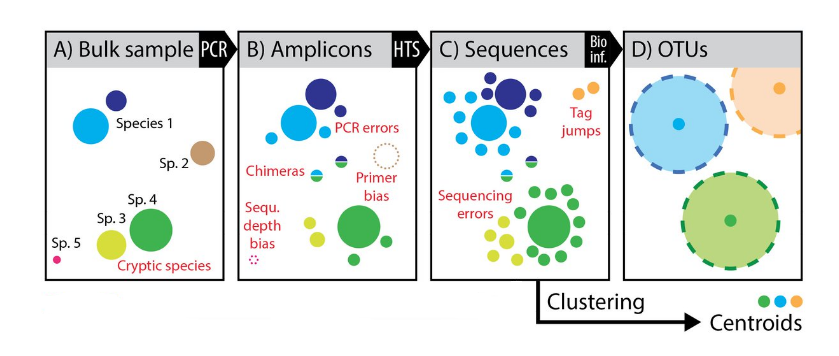
Operational Taxonomic Units
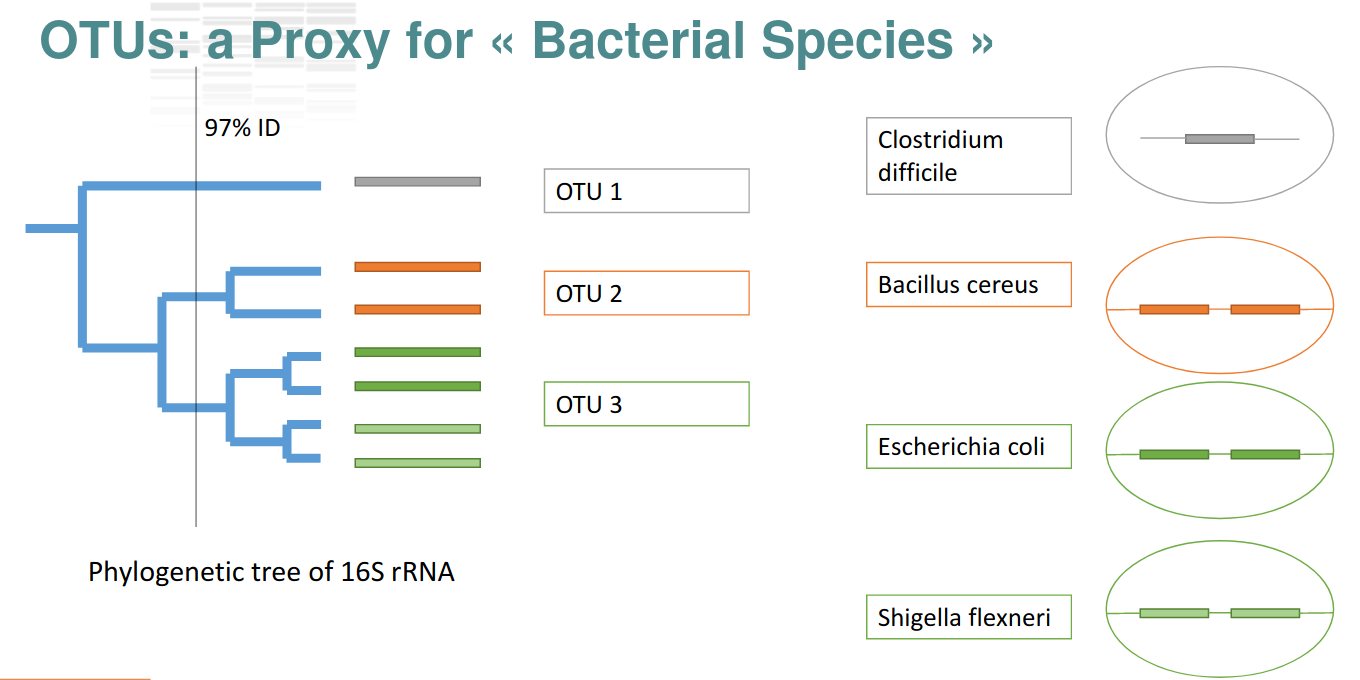
Operational Taxonomic Units
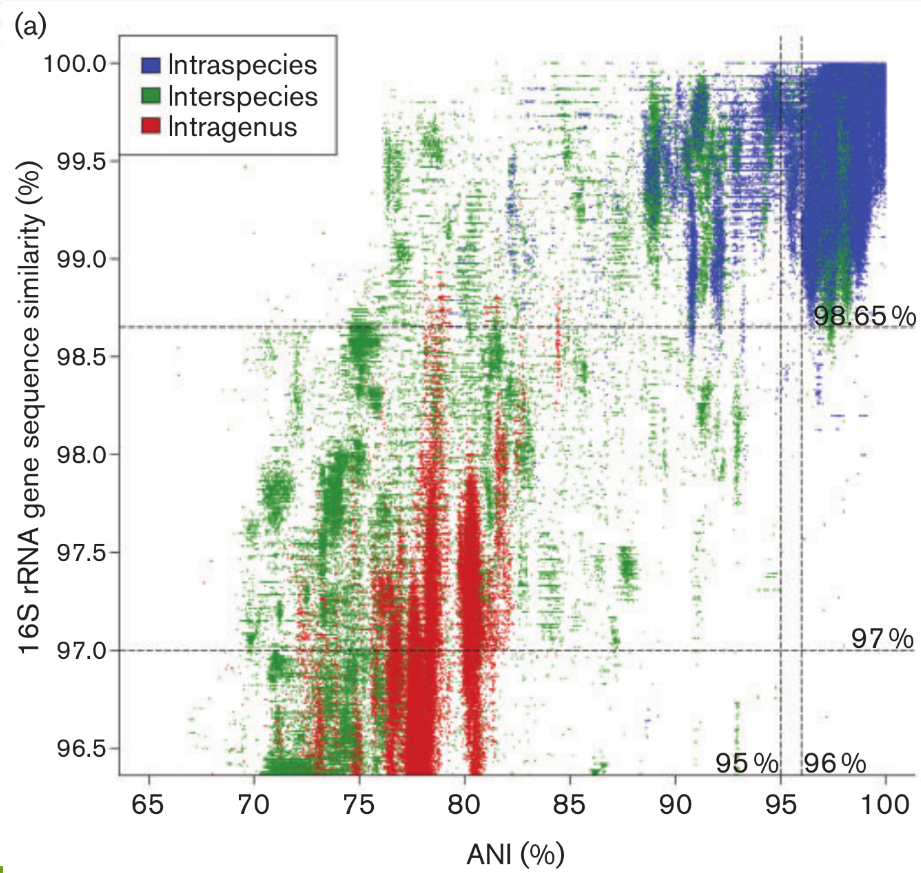
Operational Taxonomic Units
ASV paradigm
- Amplicon Sequence Variants
ASV are inferred by a de novo process in which biological sequences are discriminated from errors on the basis of the expectation that biological sequences are more likely to be repeatedly observed than are error-containing sequences
ASV resolution
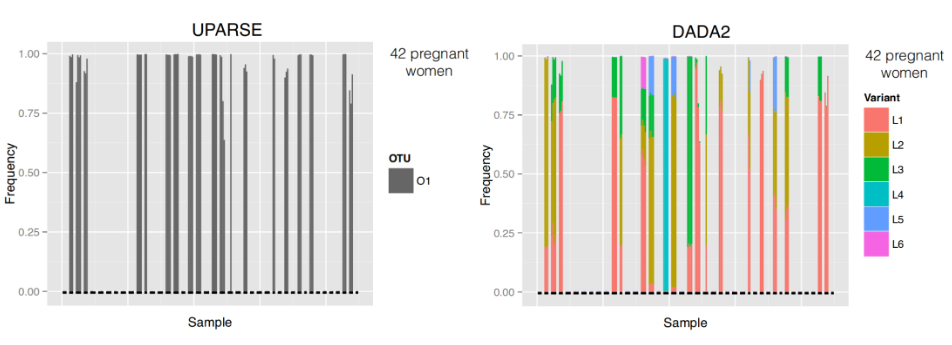
- ASV resolution changes the composition for these samples
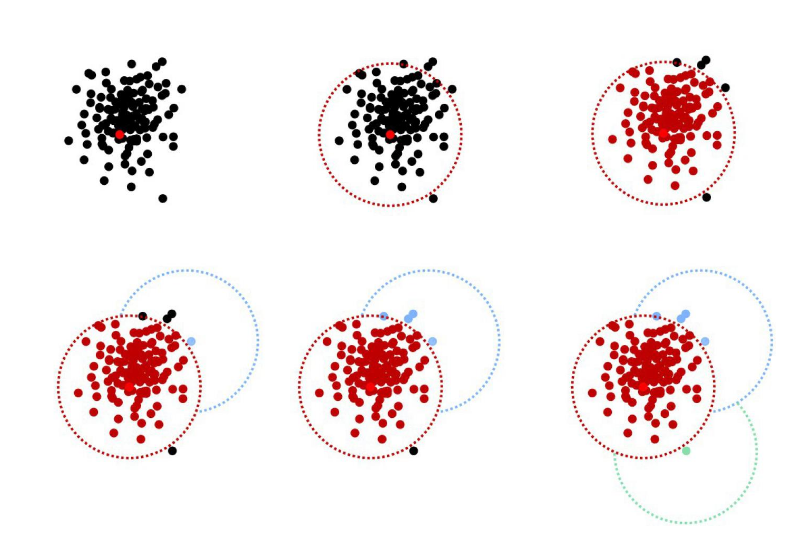
Why Swarm?
- Fixed clustering threshold is a real problem
- OTUs construction is input-order depenent
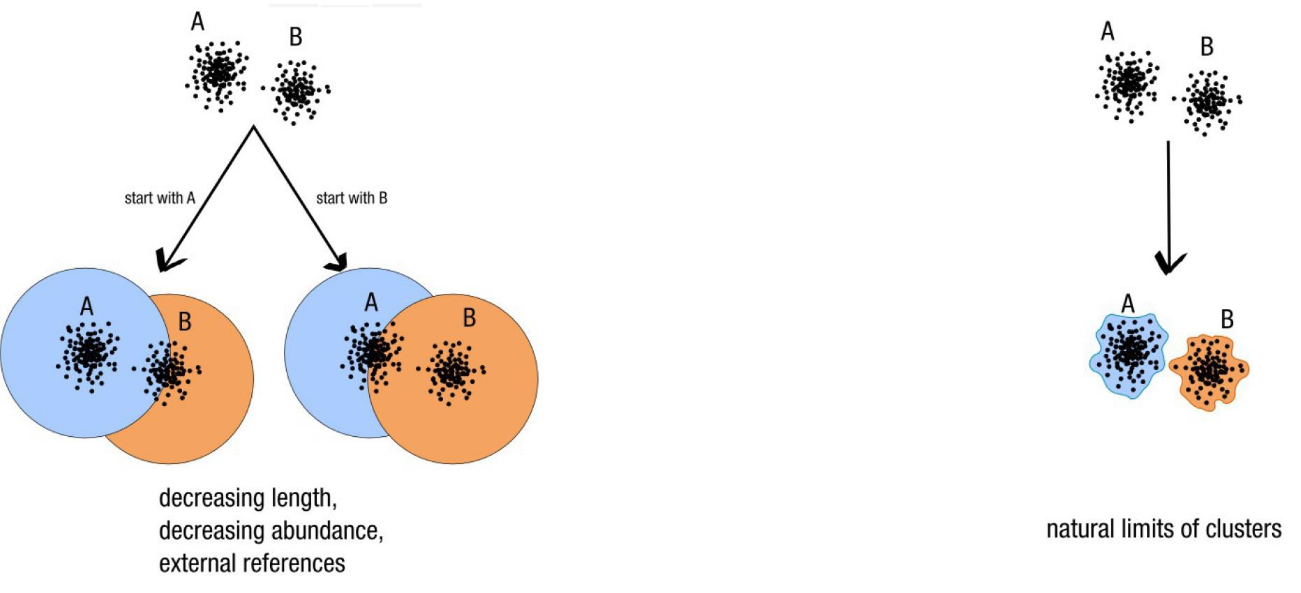
Swarm: A smart idea
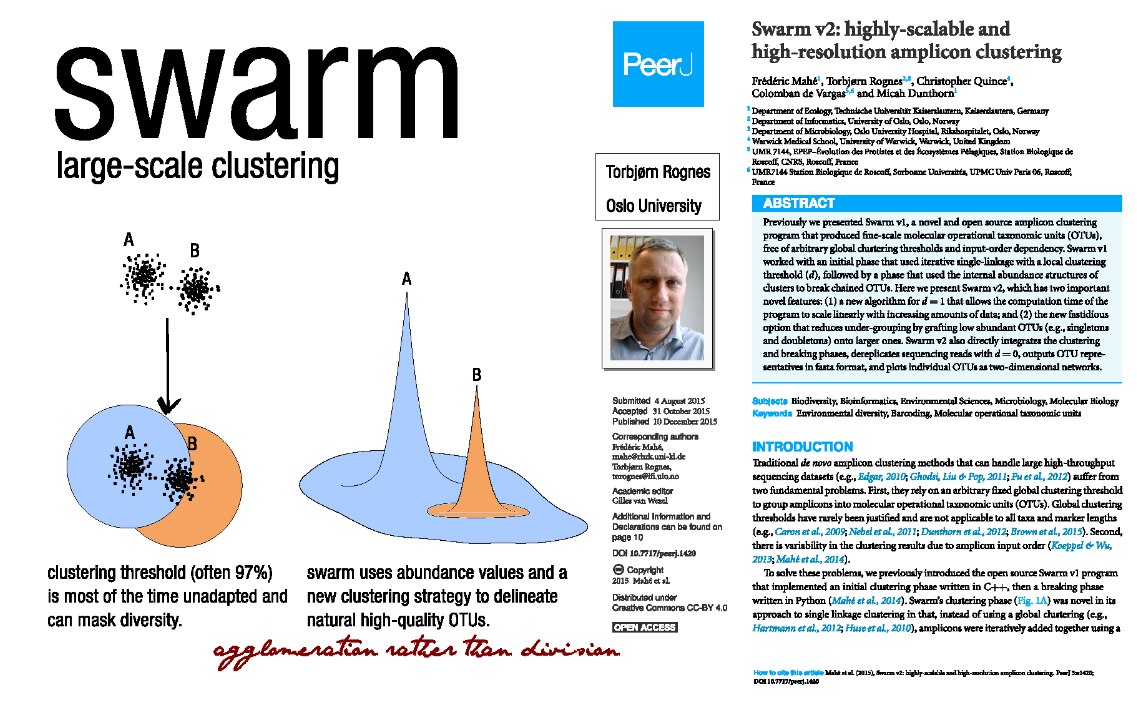
d: the small local linking threshold
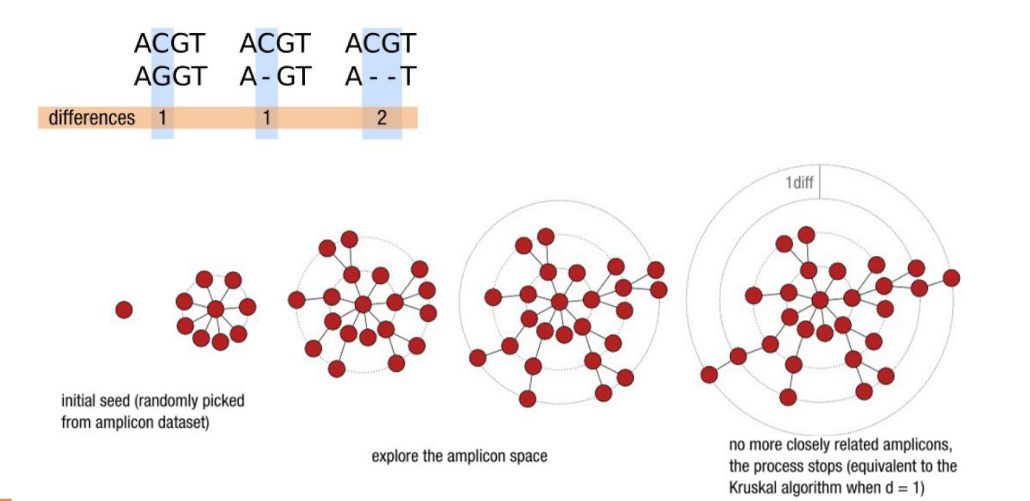
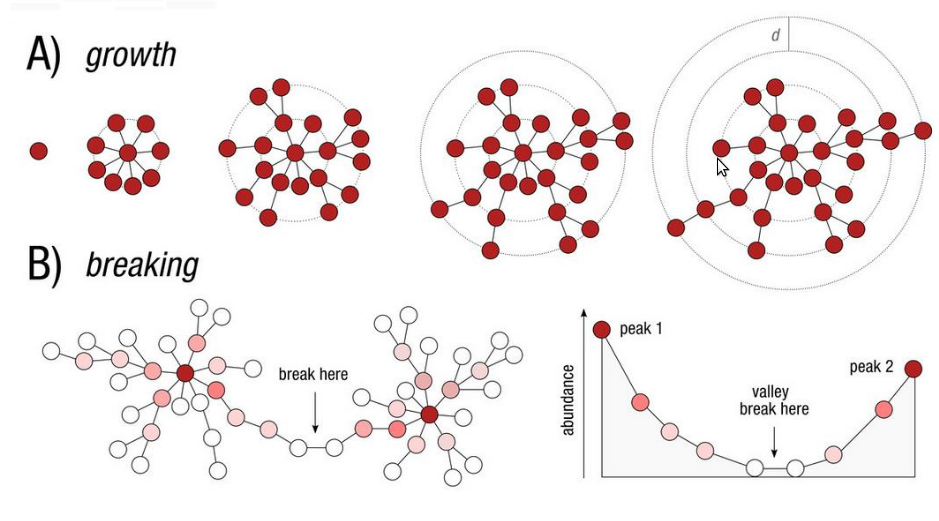
Swarm steps
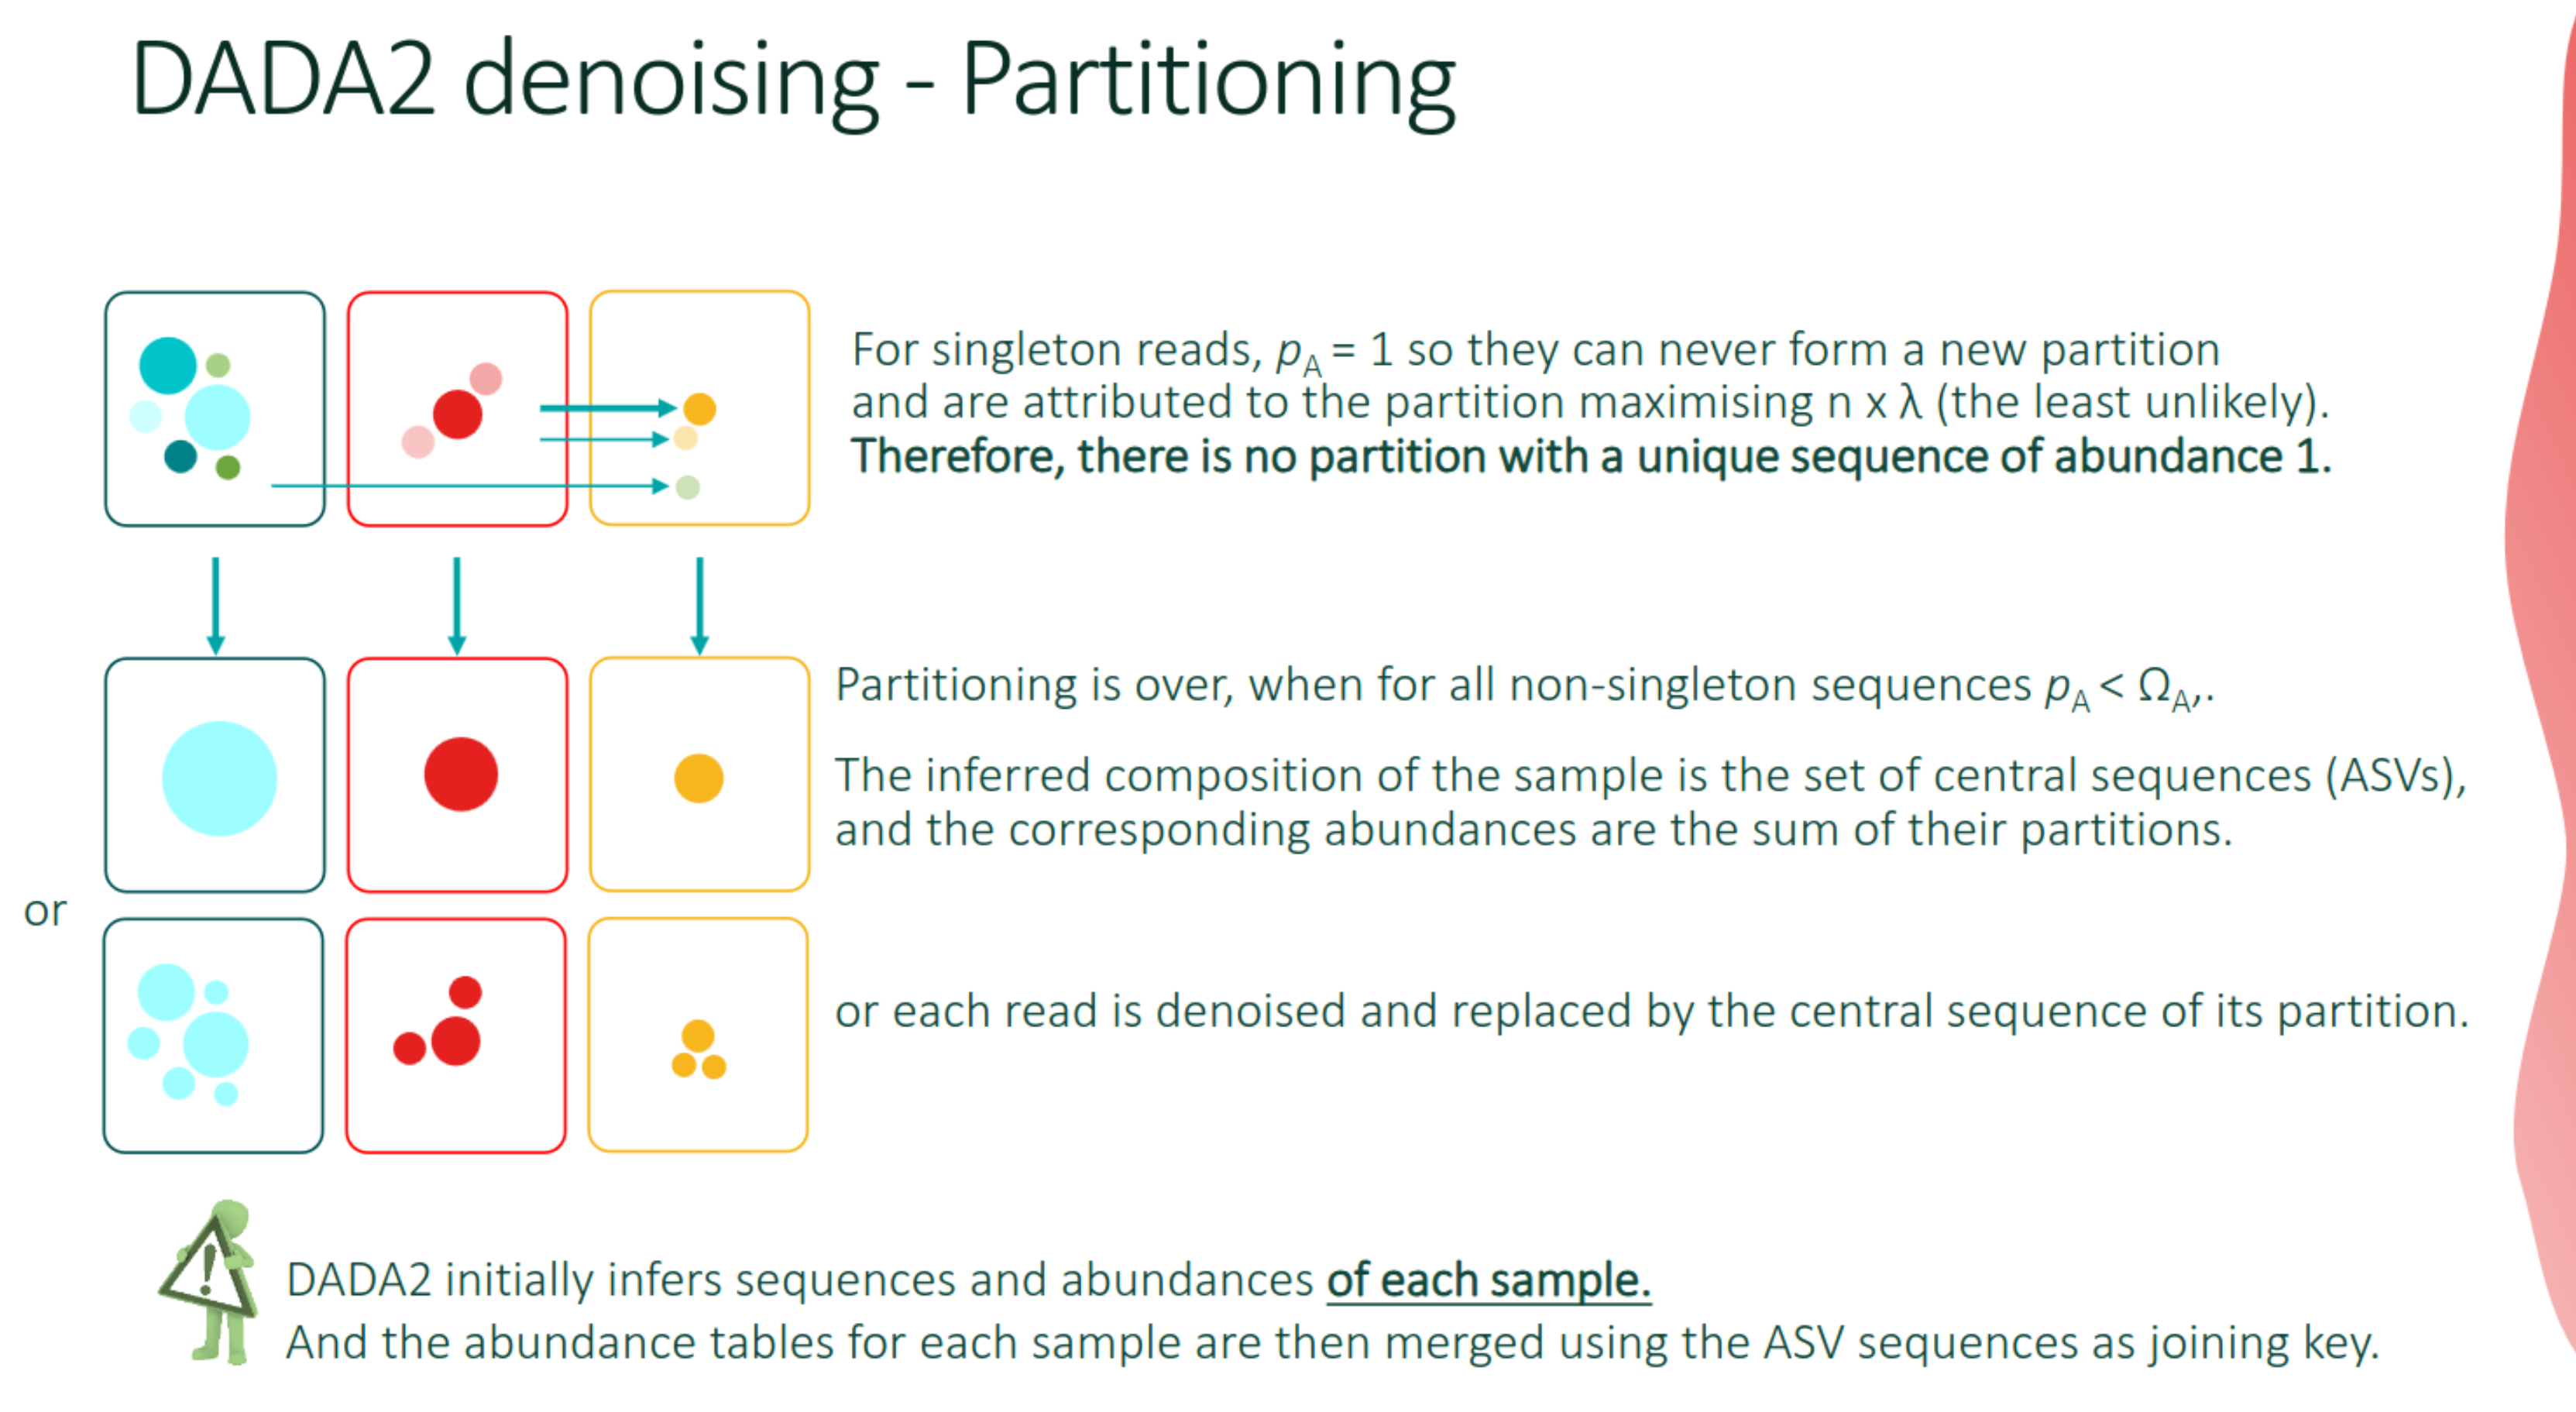
DADA2

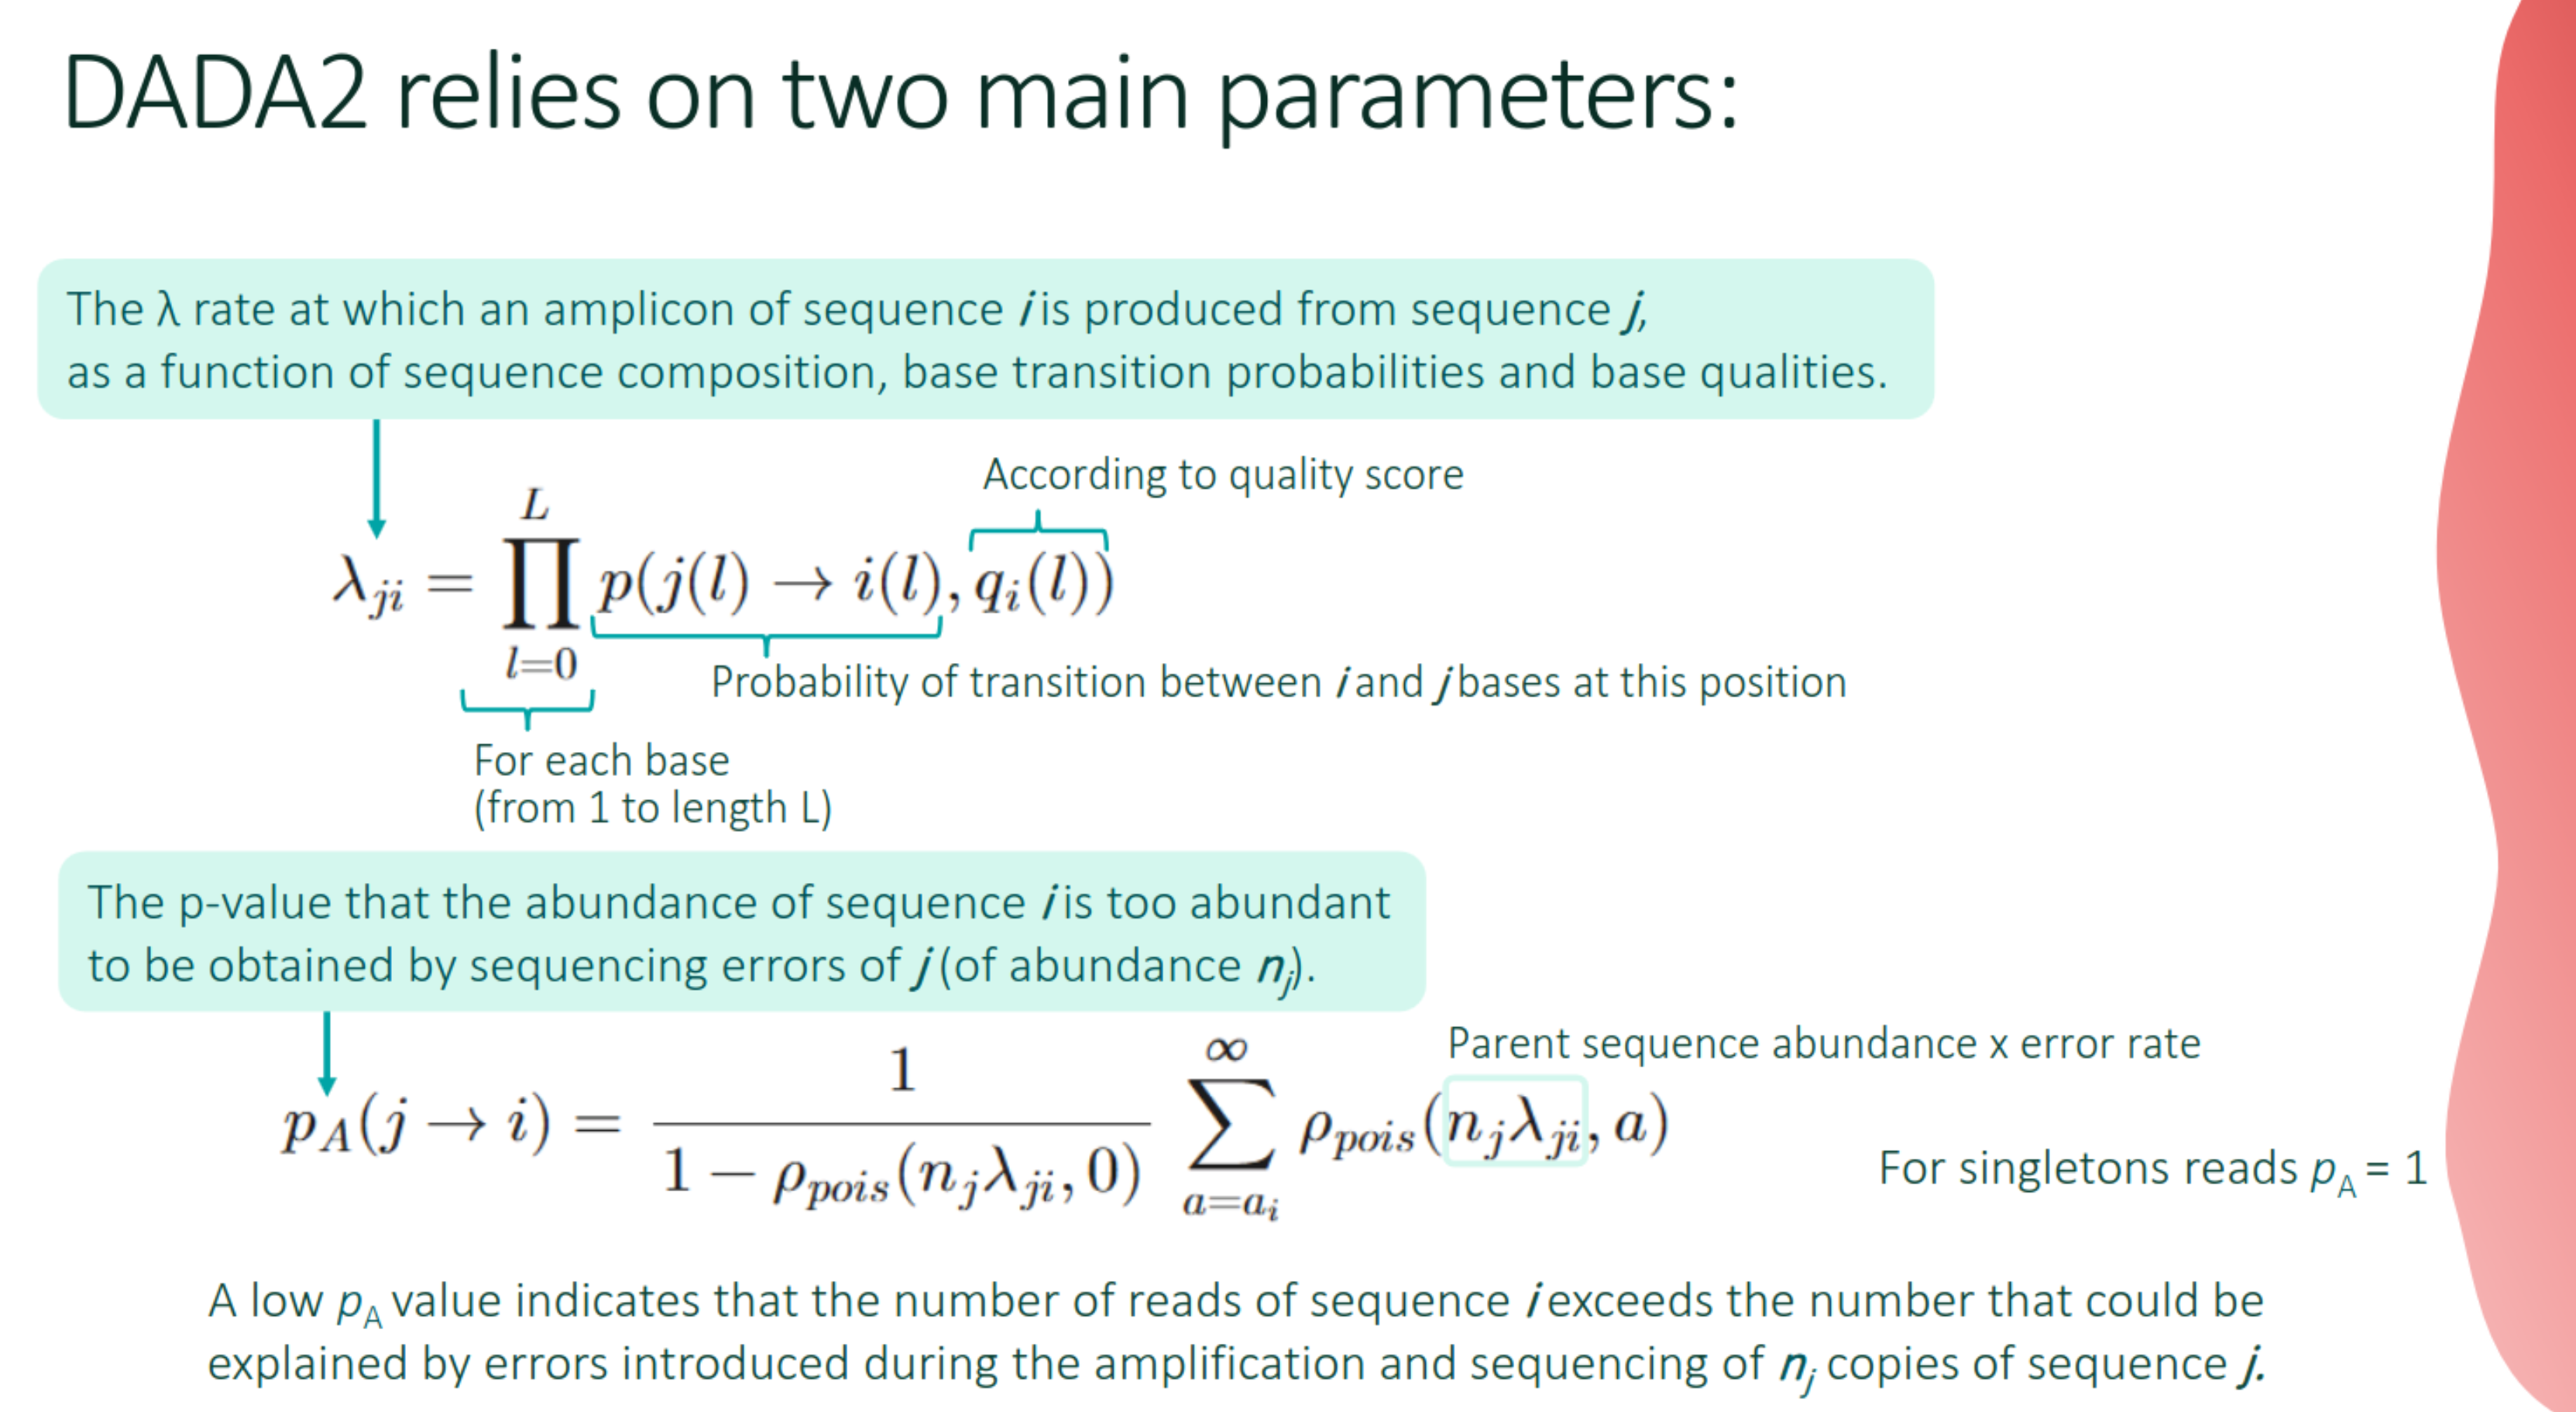
- It is a complete workflow with a new, original approach to regrouping sequences.
- It uses an error model that incorporates read quality information, and estimate the probability that a low-abundance read is an error derived from a more abundant read (incorporating specific base- transitions probabilities, computed on the dataset).
- In FROGS, only the
denoisingalgorithm is included.
DADA2
DADA2
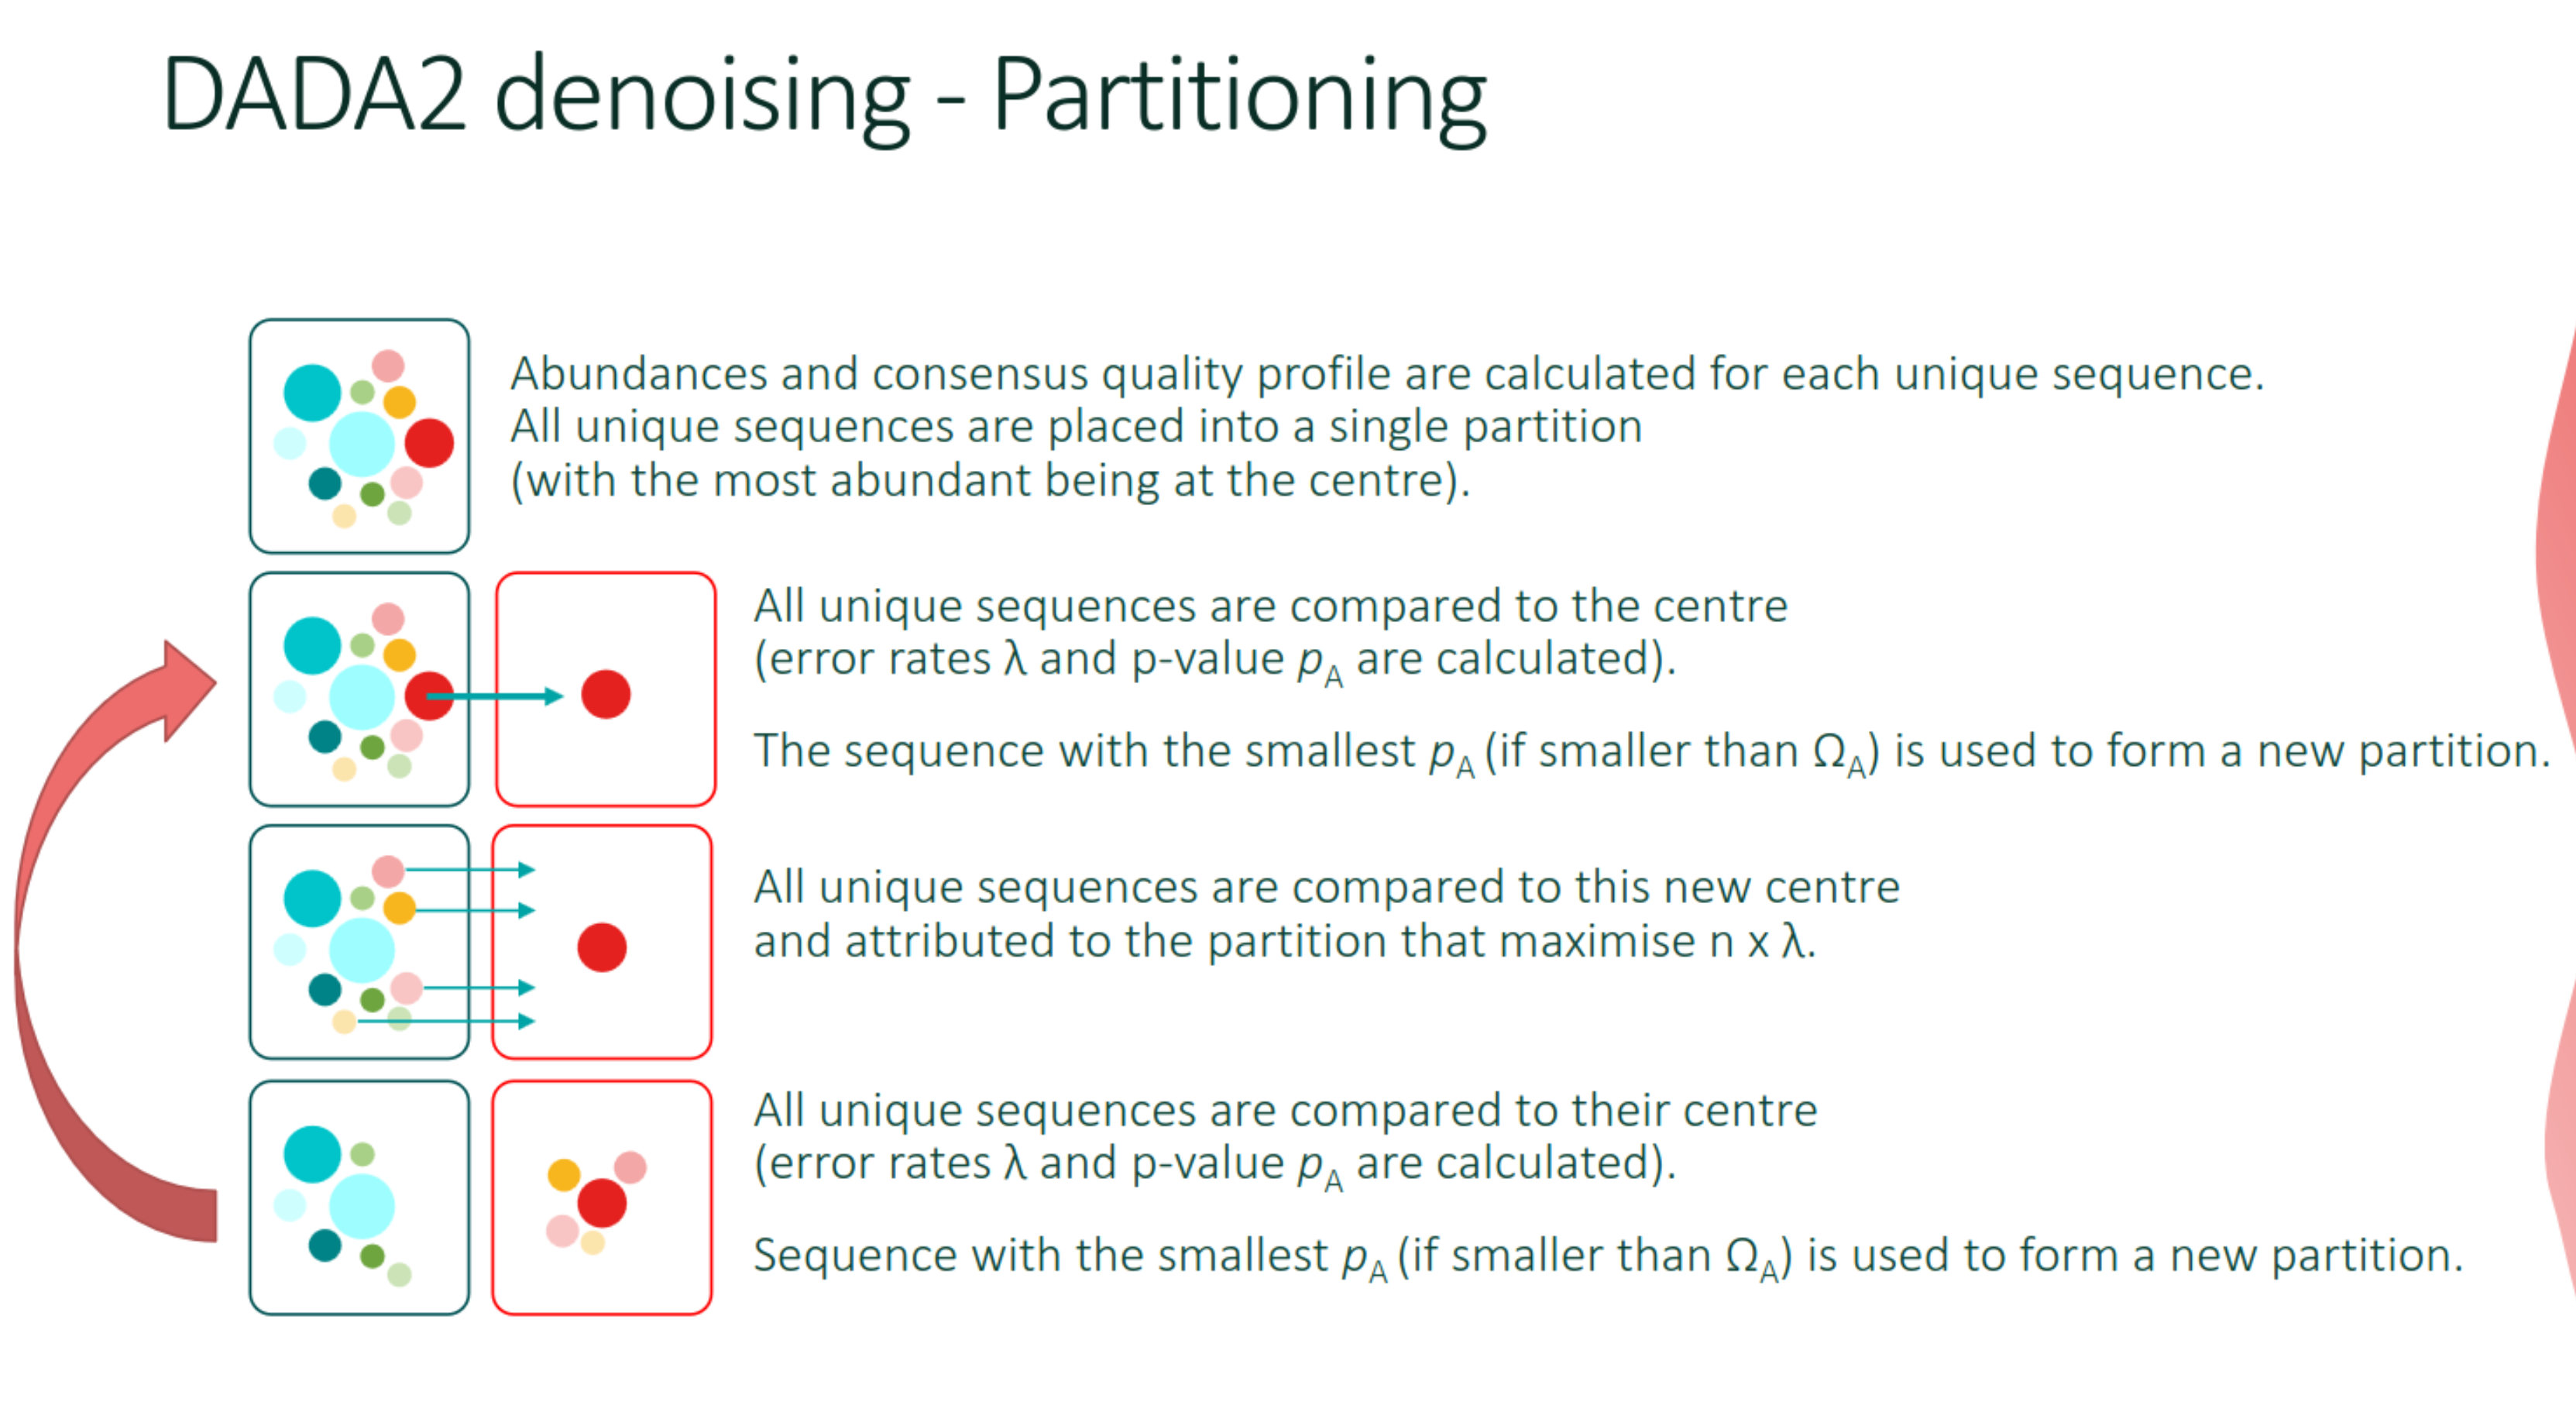
DADA2
TP FROGS read processing
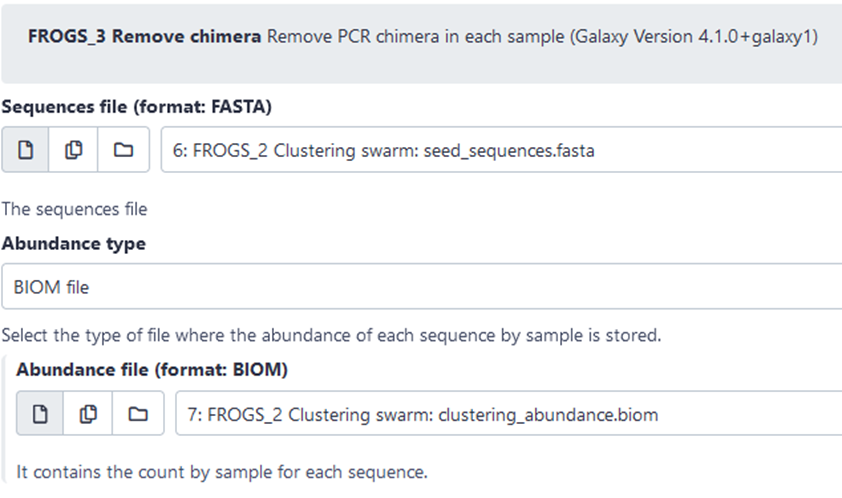
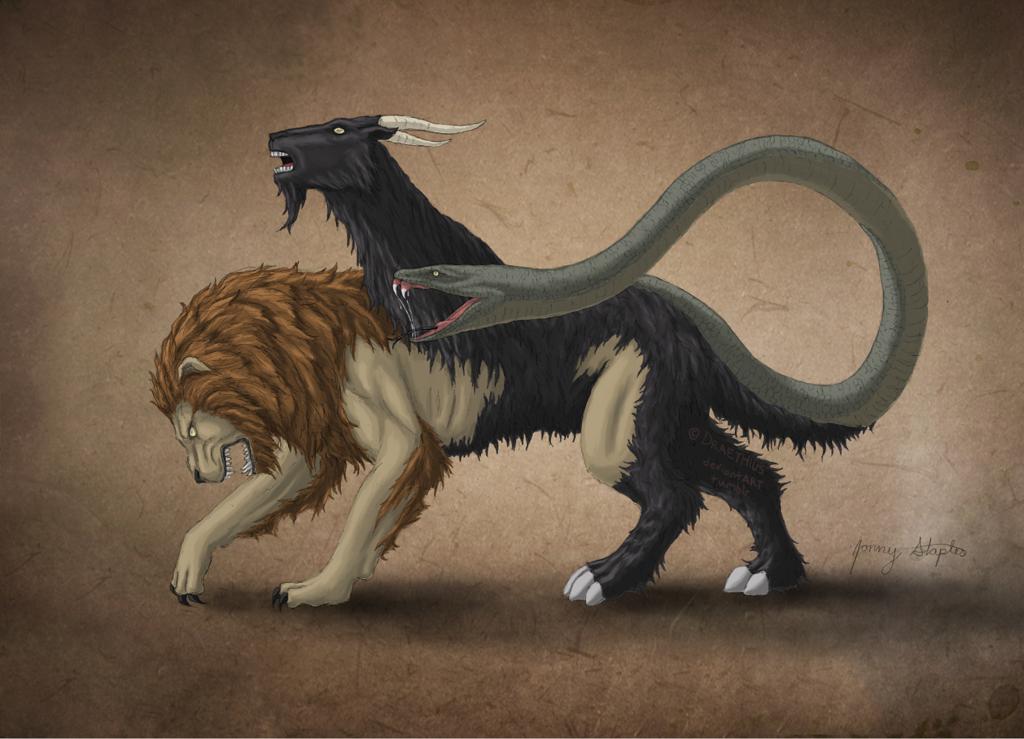
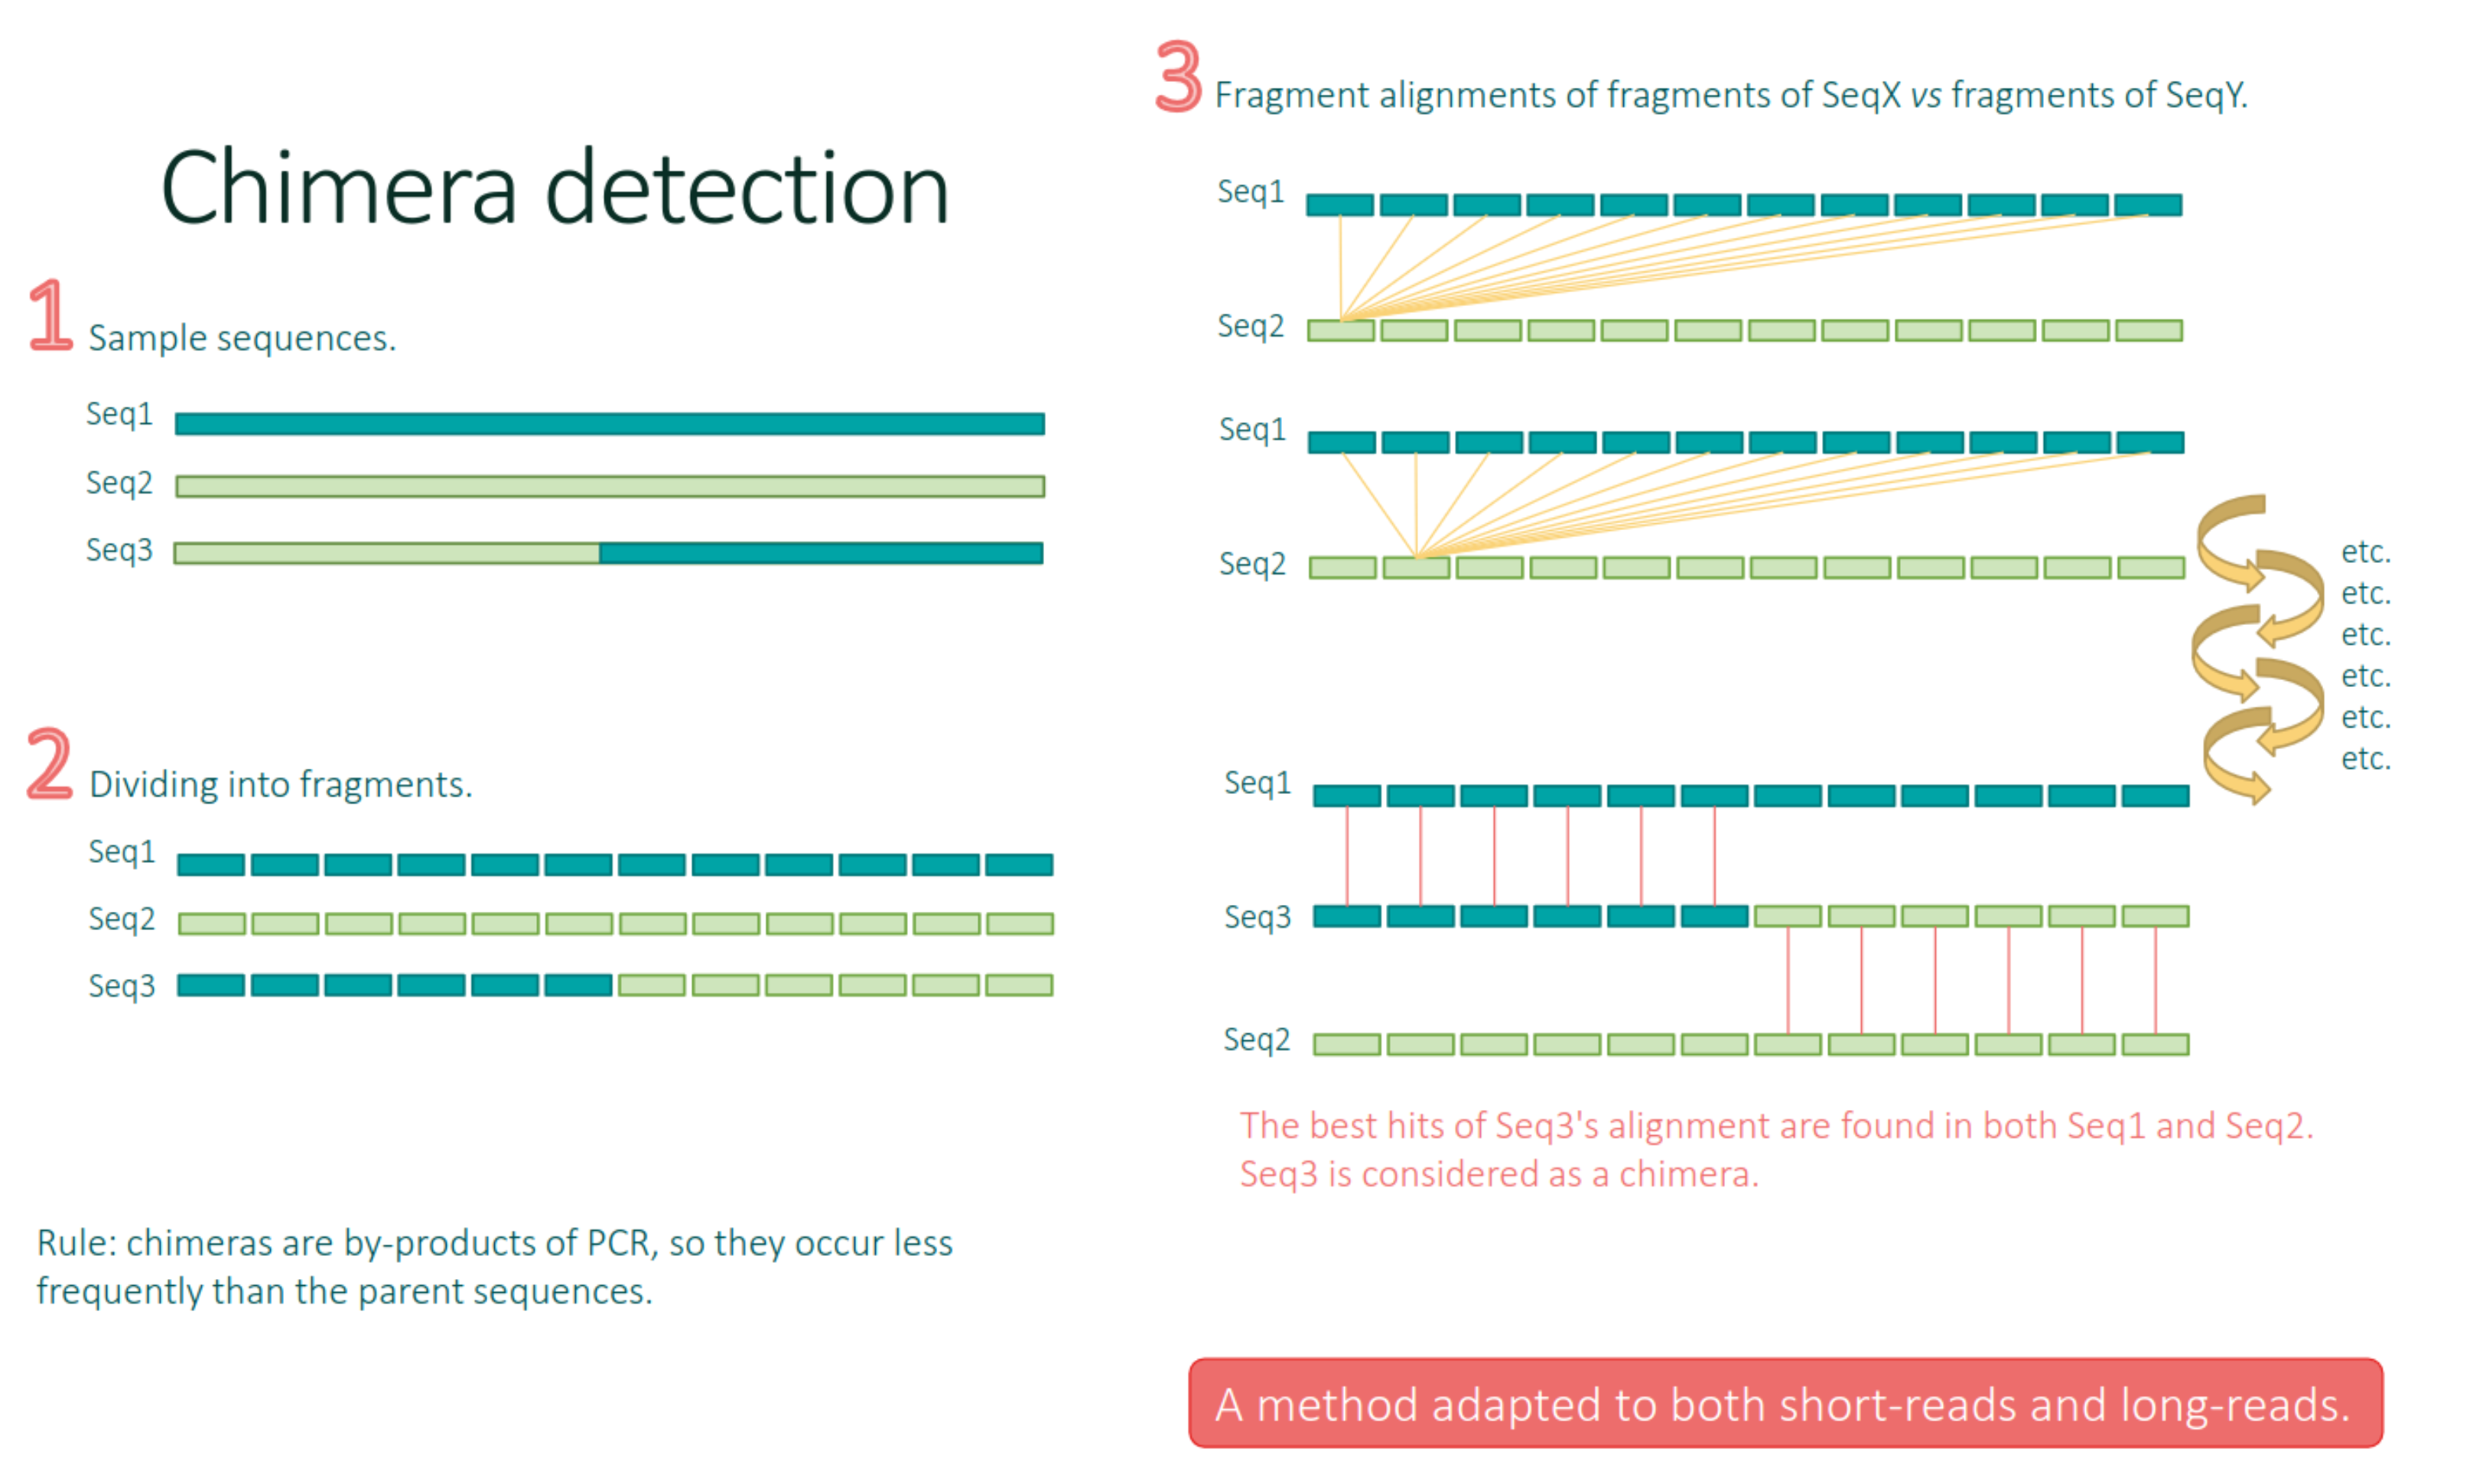
Remove chimera
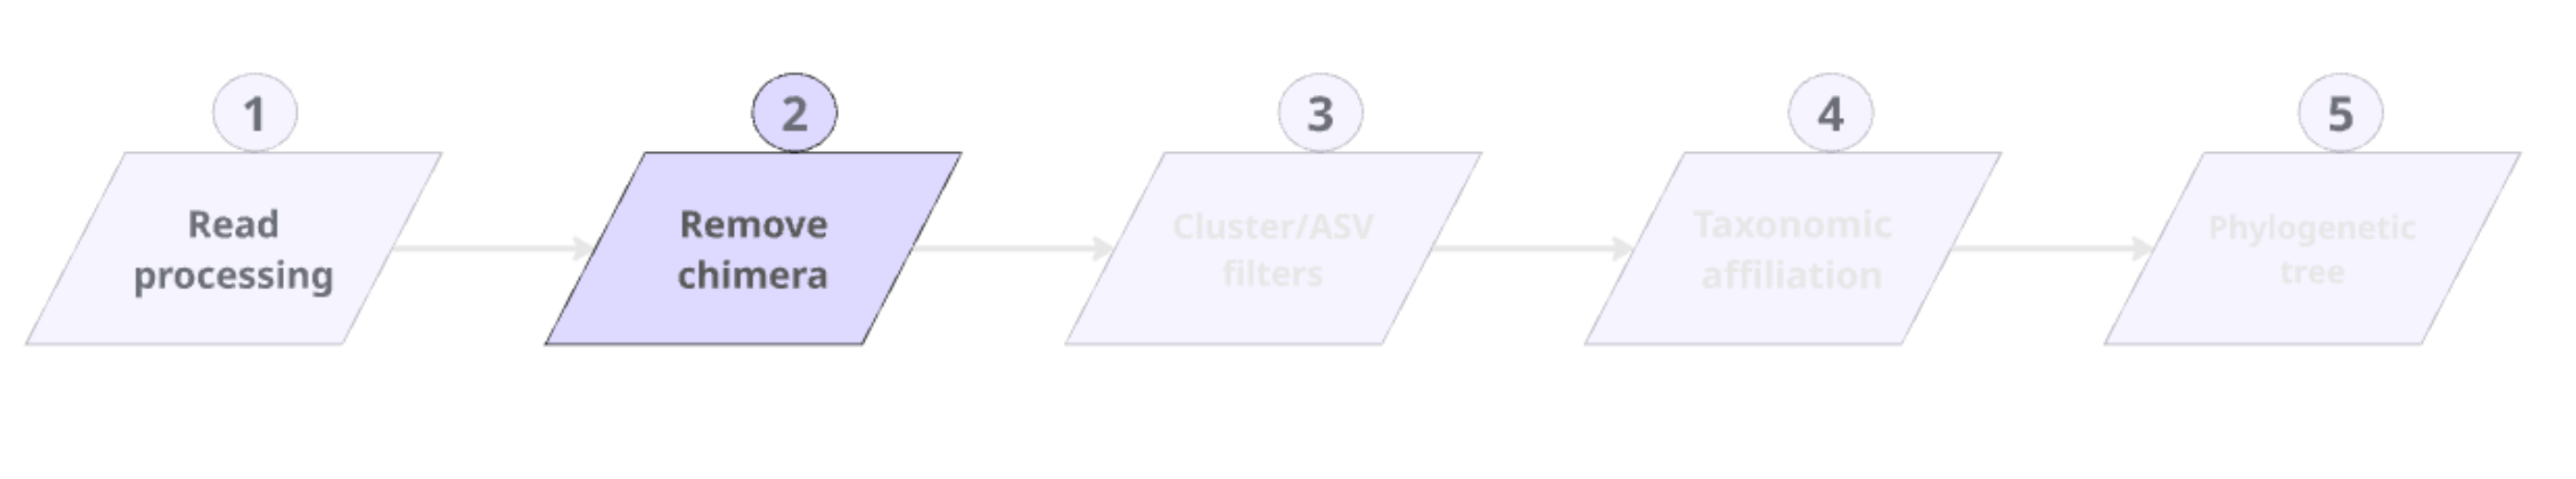
Chimera removal
FROGS remove chimera
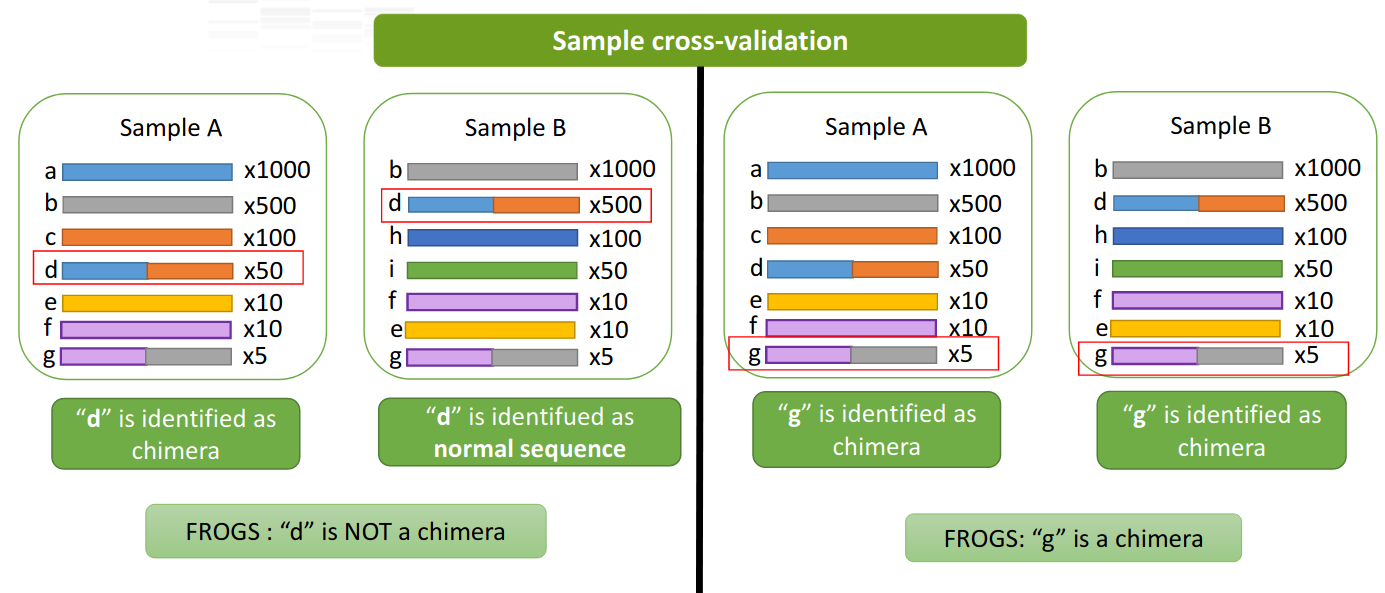
A little extra: the sample-cross validation
- FROGS adds a sample-cross validation
Chimera rates in samples
- From 5 to 40% in 16S data
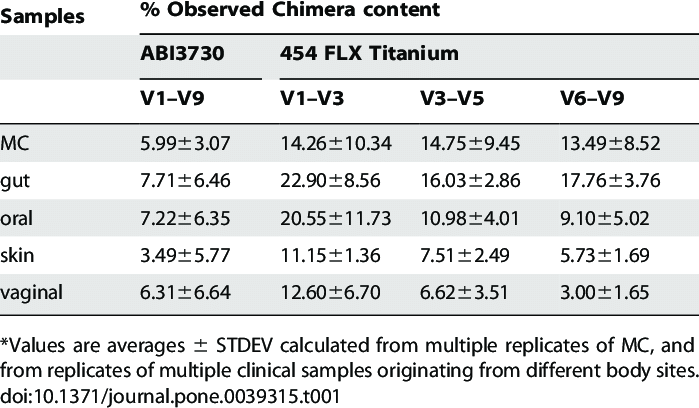
- Few with ITS (<10%)
TP FROGS Remove chimera
Abundance/Prevalence filters

TP Frogs Cluster/ASV filters
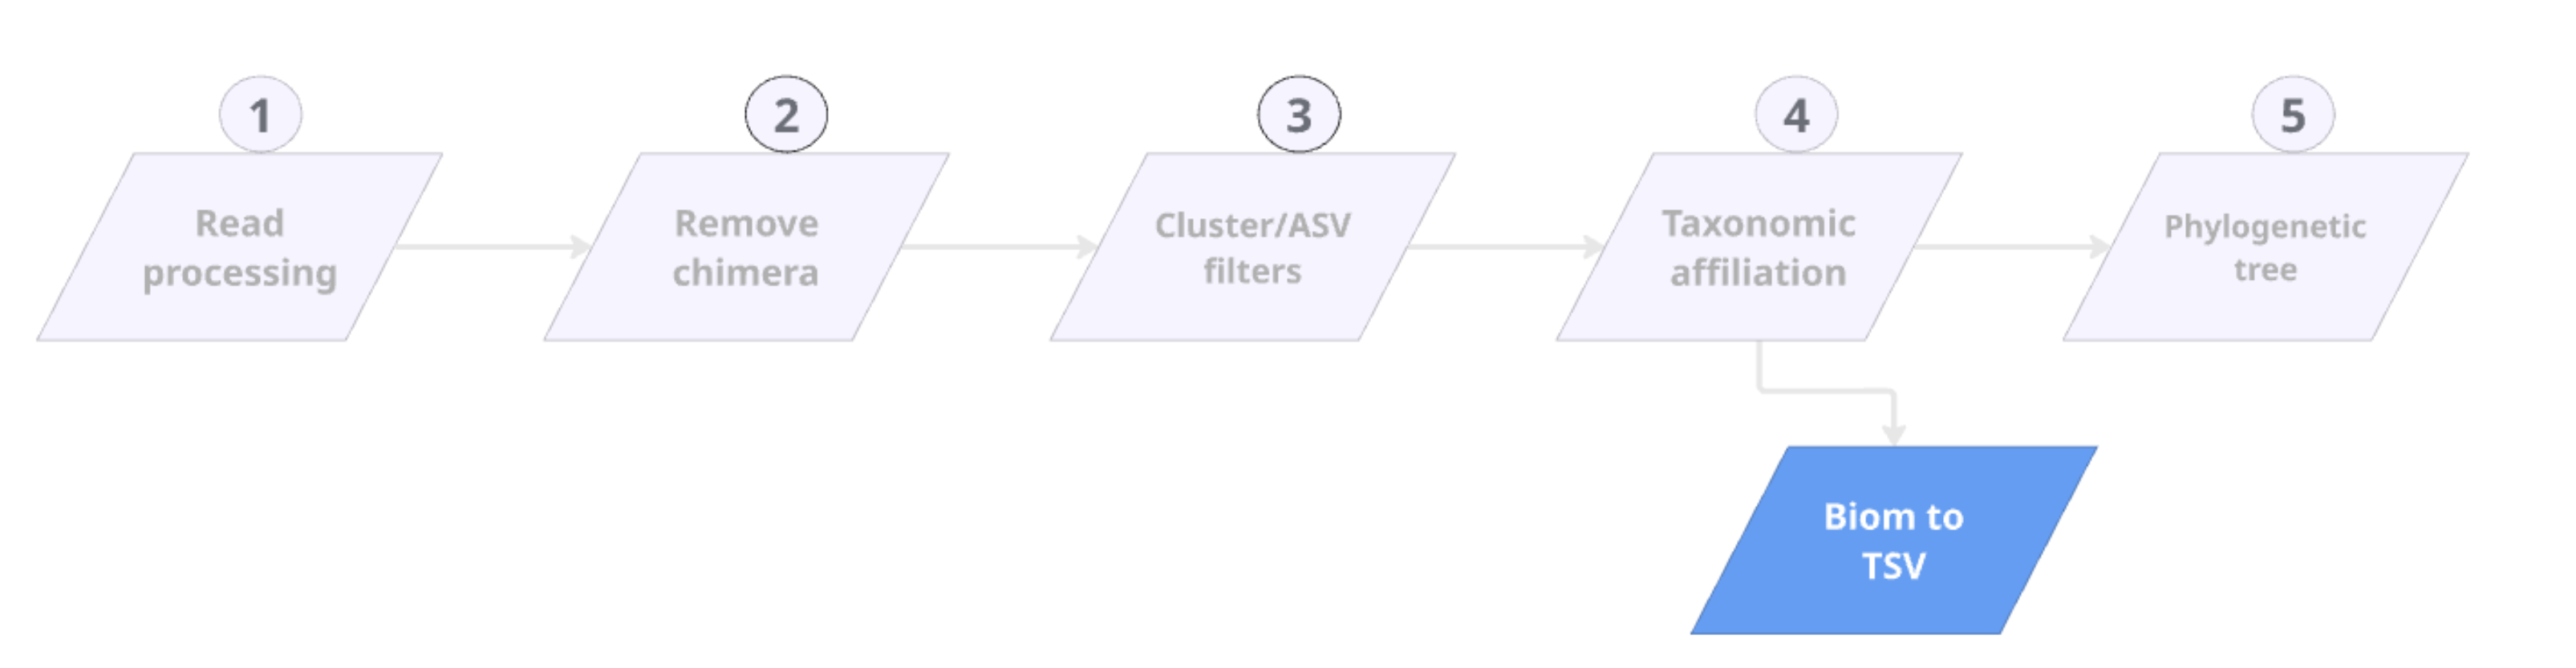
Taxonomic affiliation
Comparison of approaches
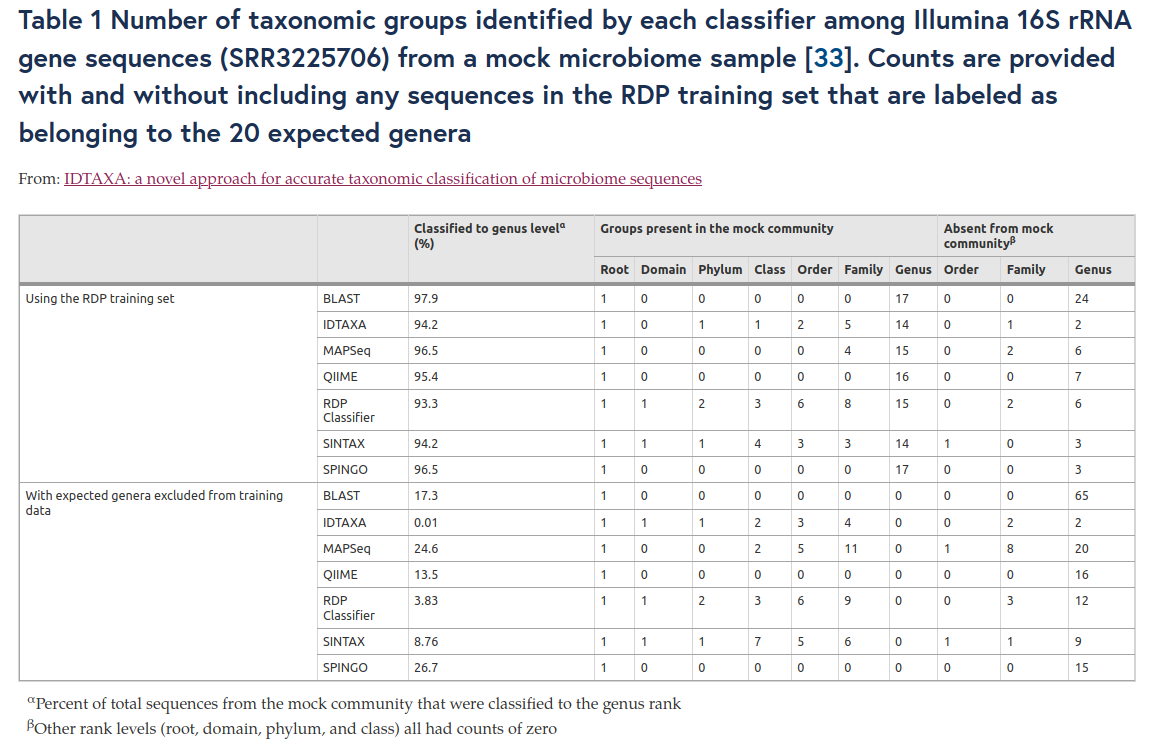
LEAP hels you to choose the appropriate databank

TP FROGS Taxonomic Affiliation
TP FROGS Biom to TSV
Filter ASVs based on their affiliations

Phylogenetic tree
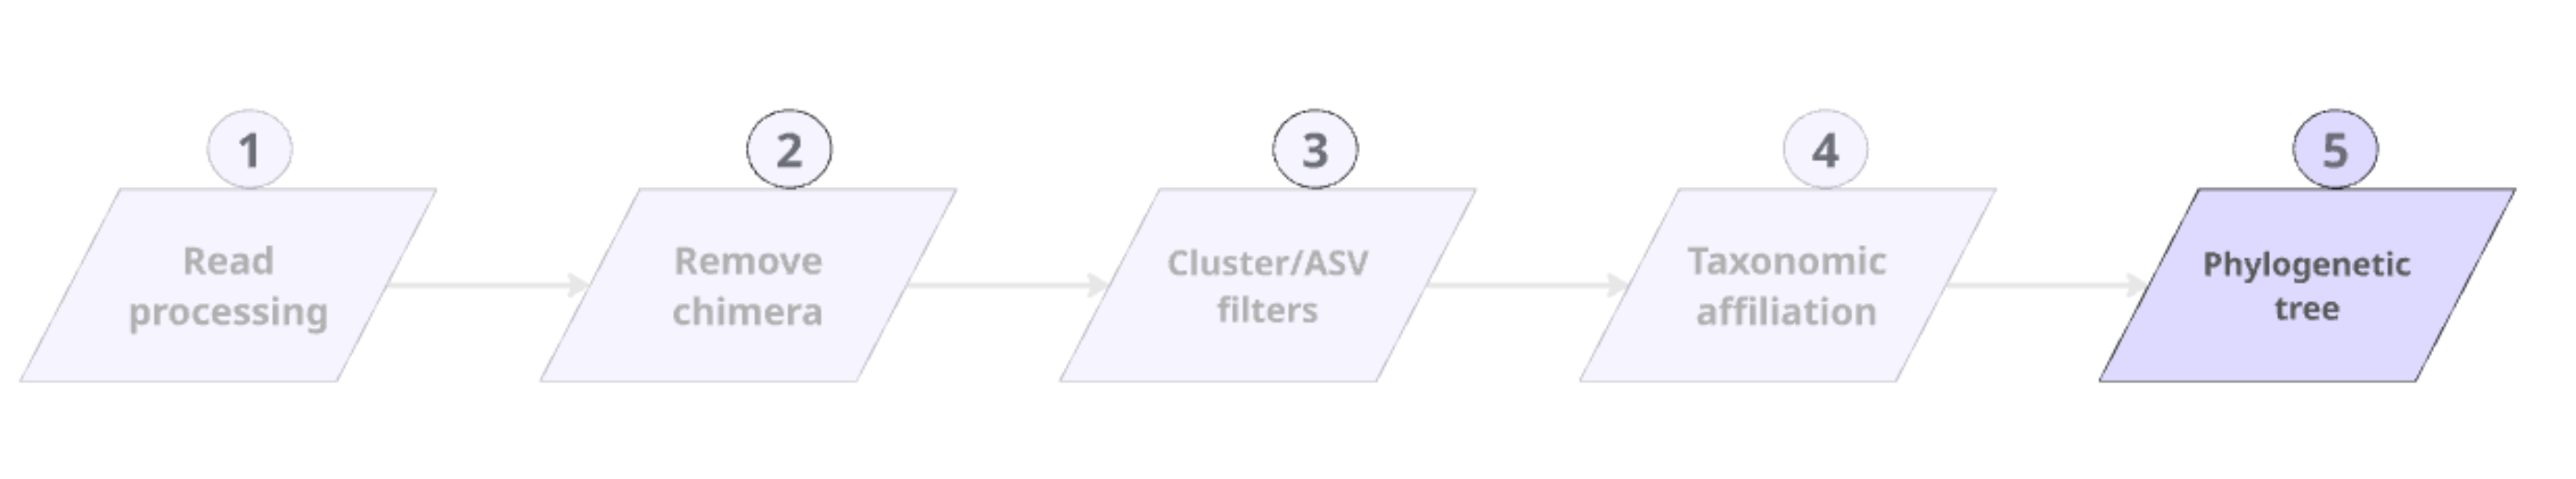
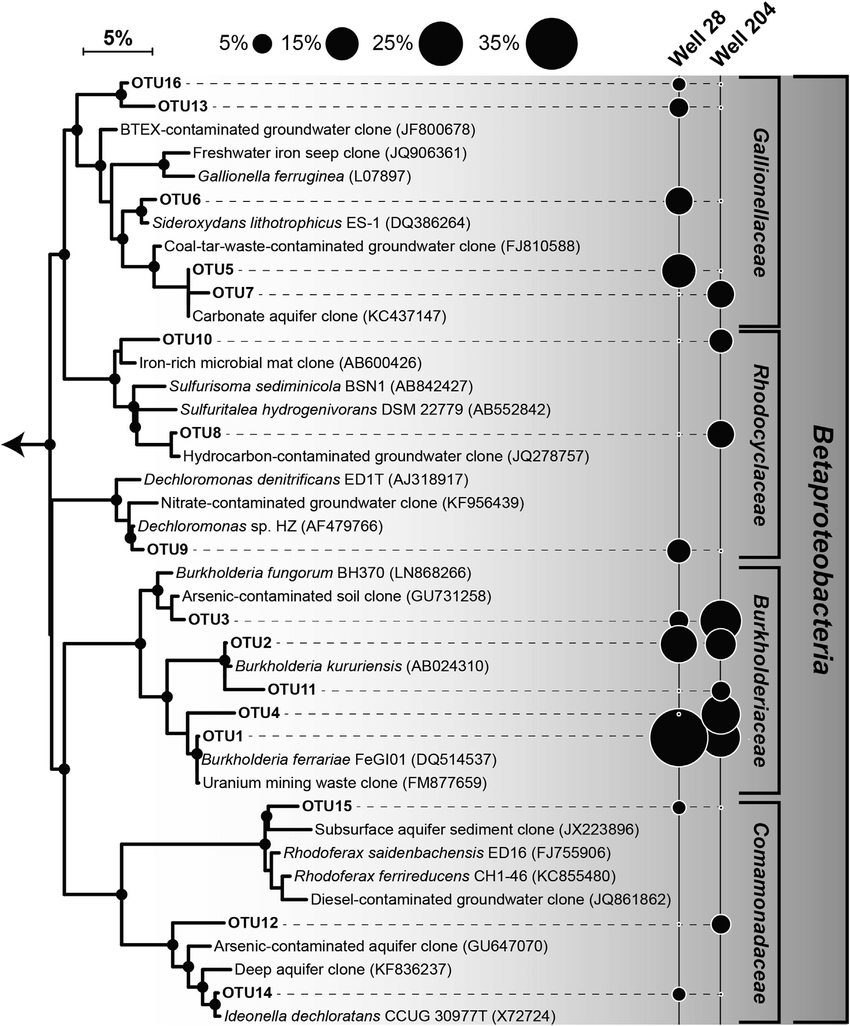
FROGS tree
- This tool builds a phylogenetic tree thanks to affiliations of ASVs contained in the BIOM file
- Needed to compute beta-diversity indices based on phylogenetic distances
- Interesting to explore poor-characterized environments
TP FROGS Tree
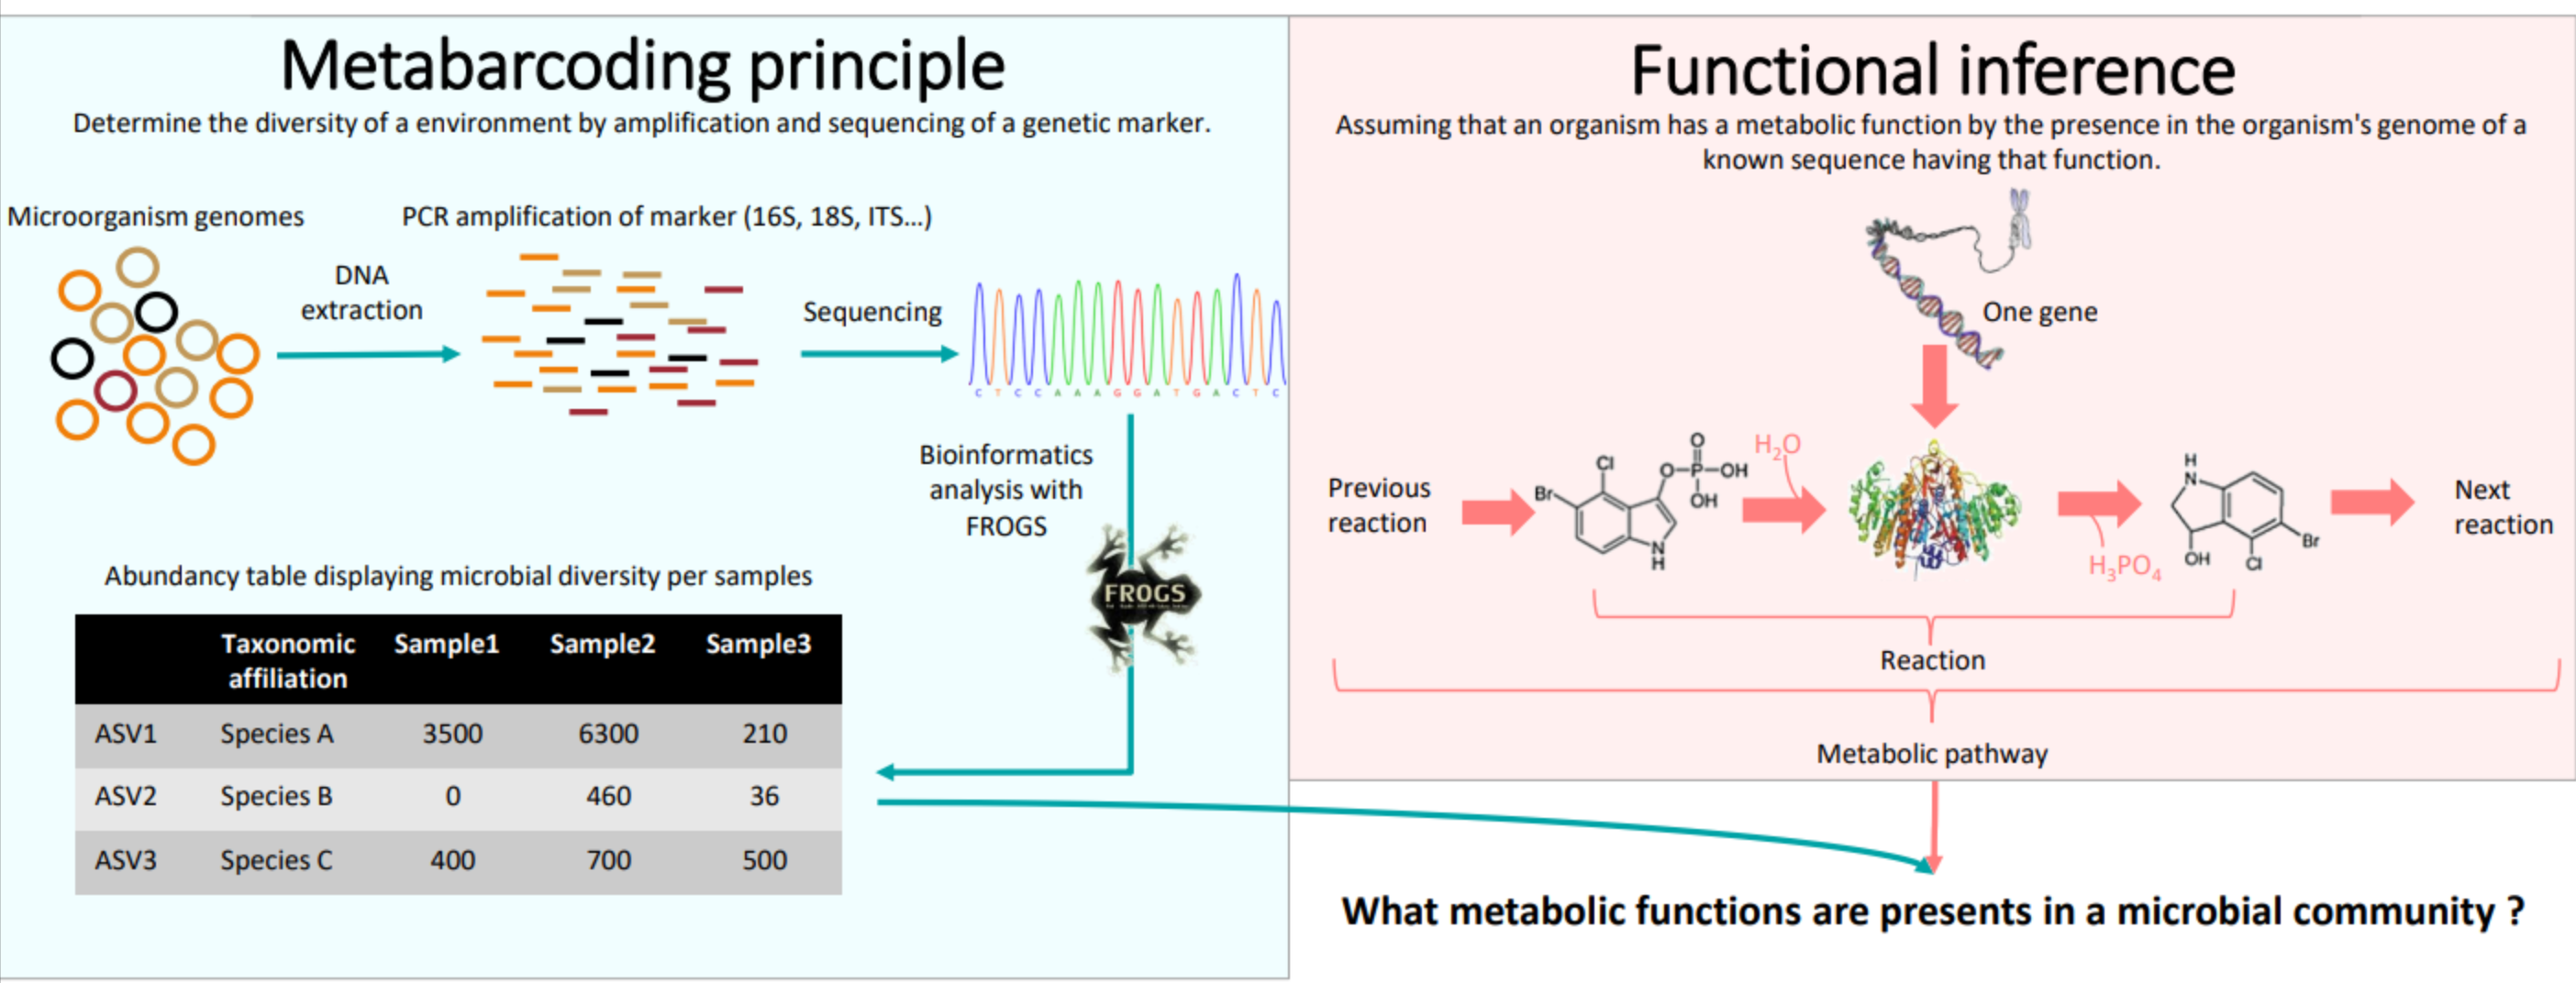
FROGSfunc: function inference
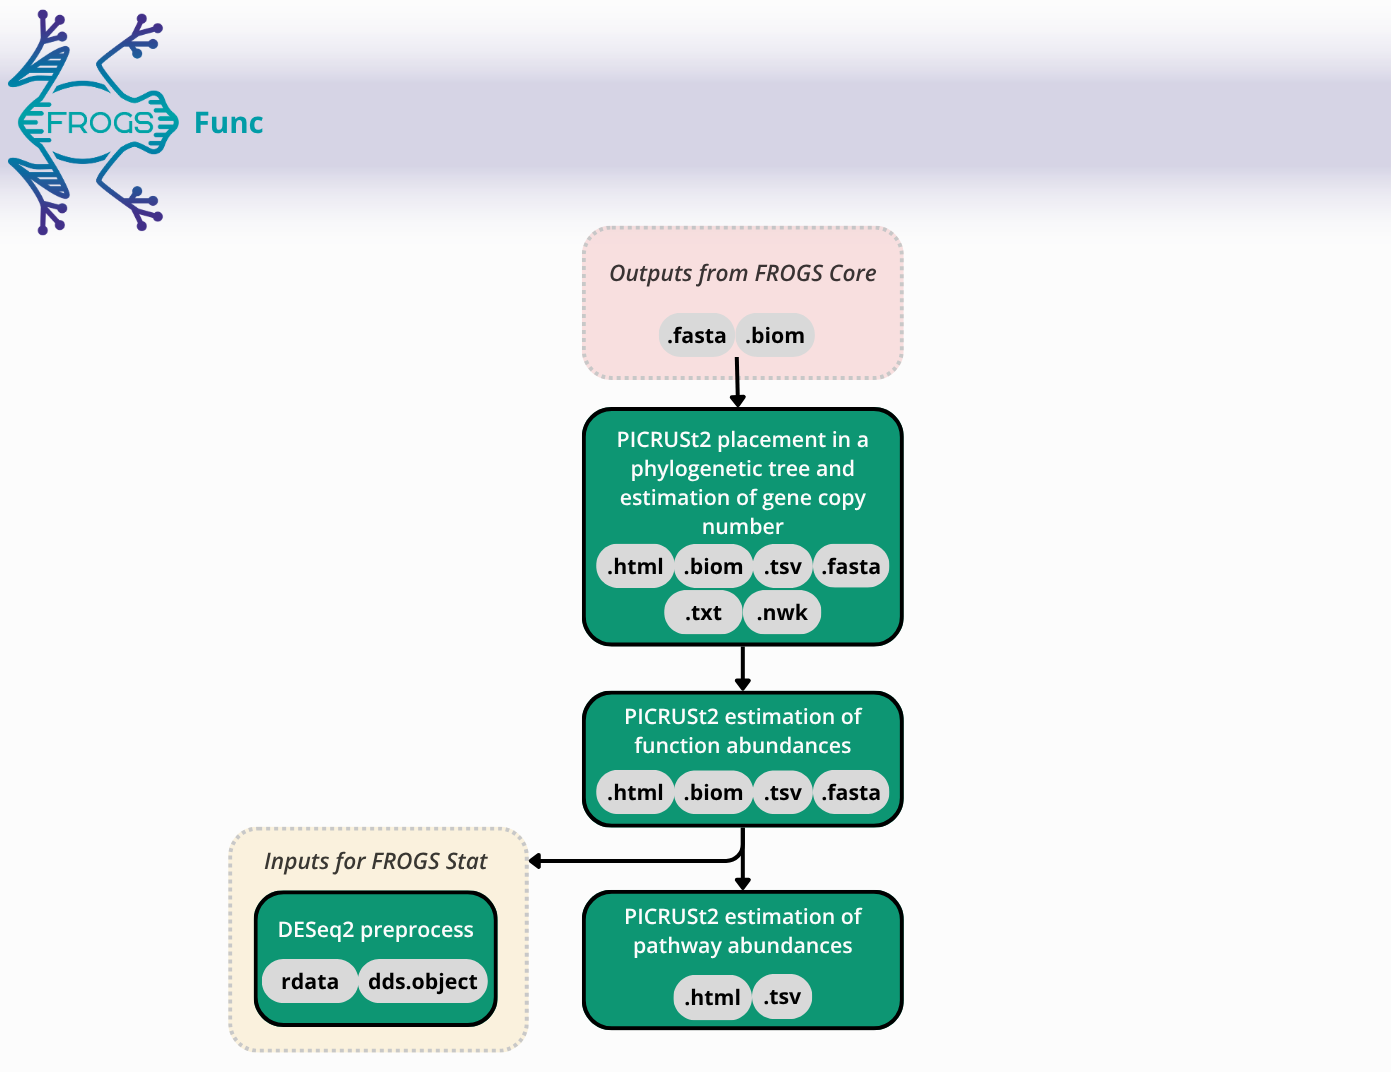
Concepts
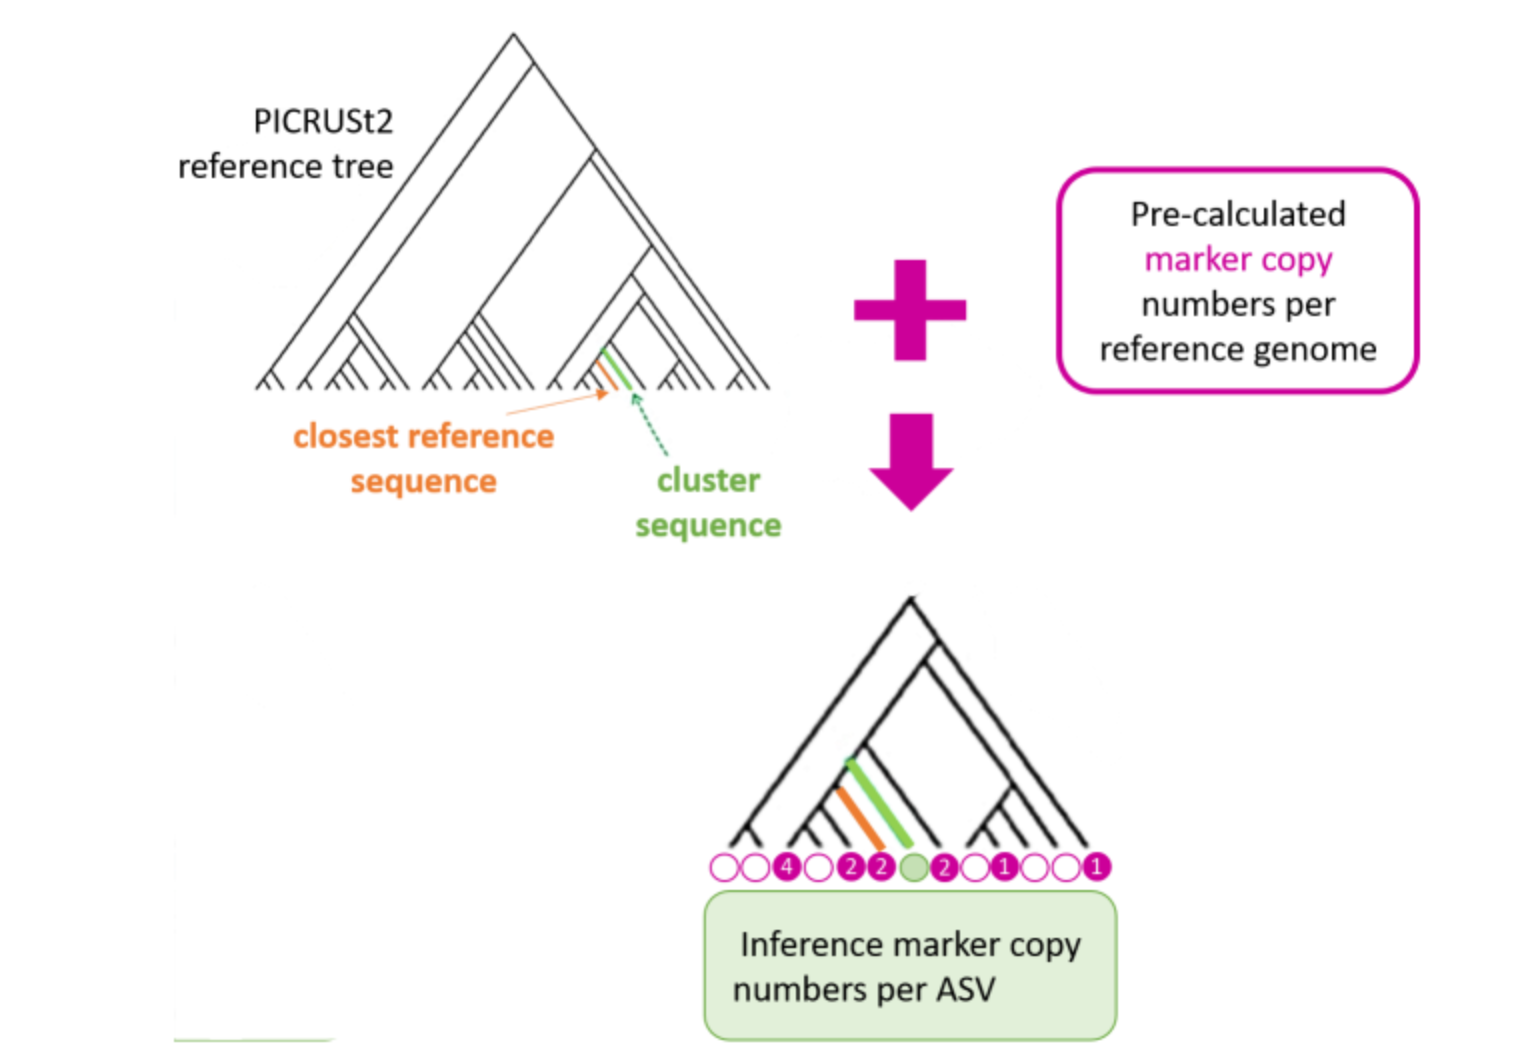
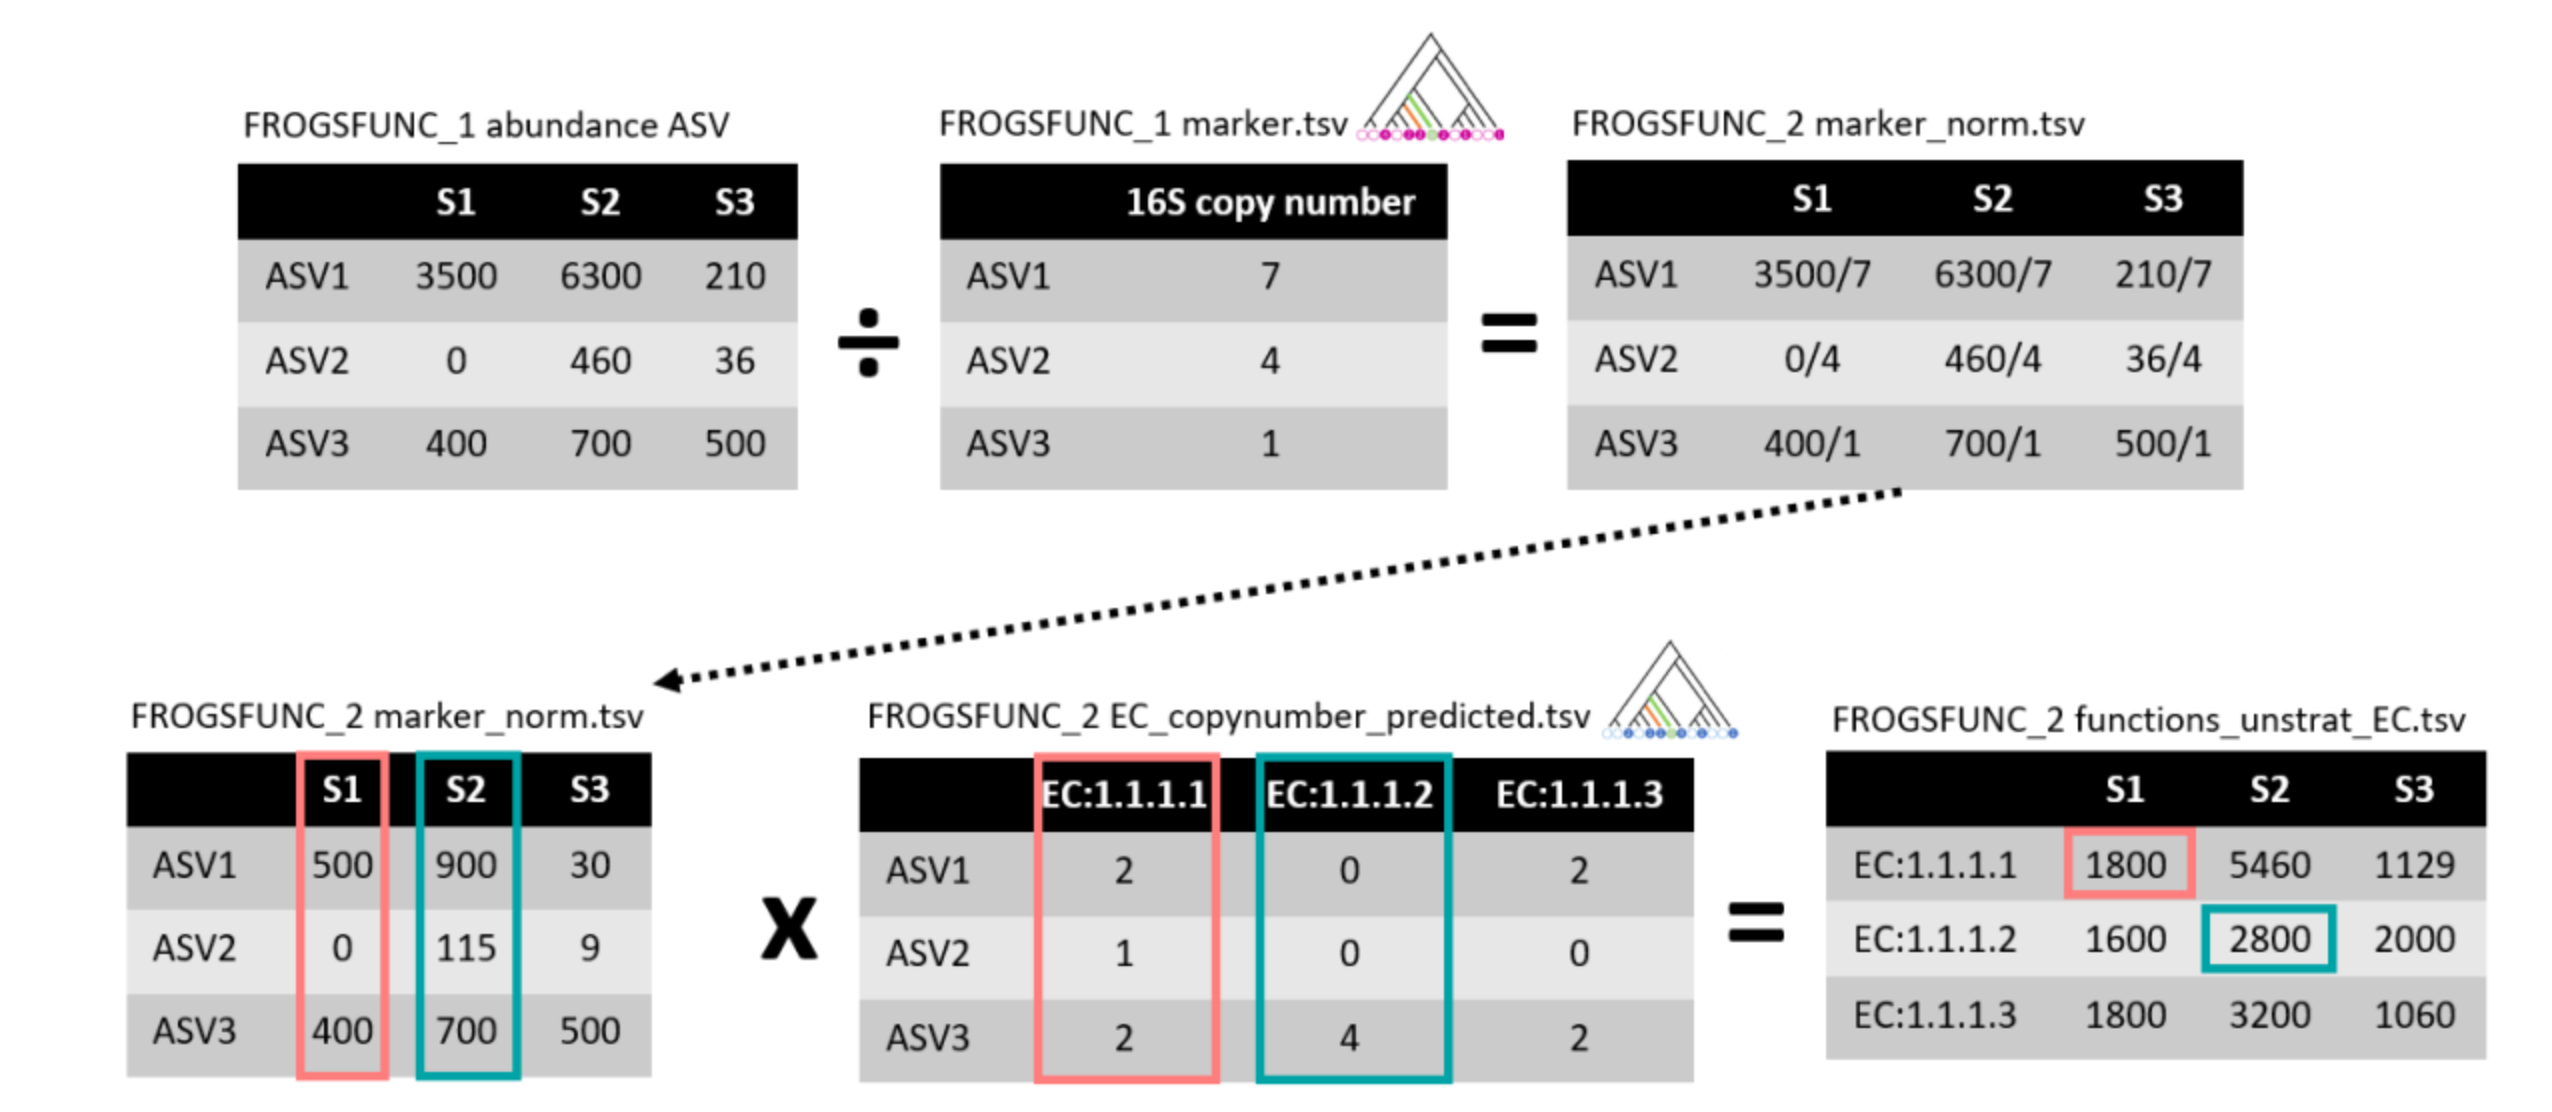
FROGSfunc placeseqs and copynumber
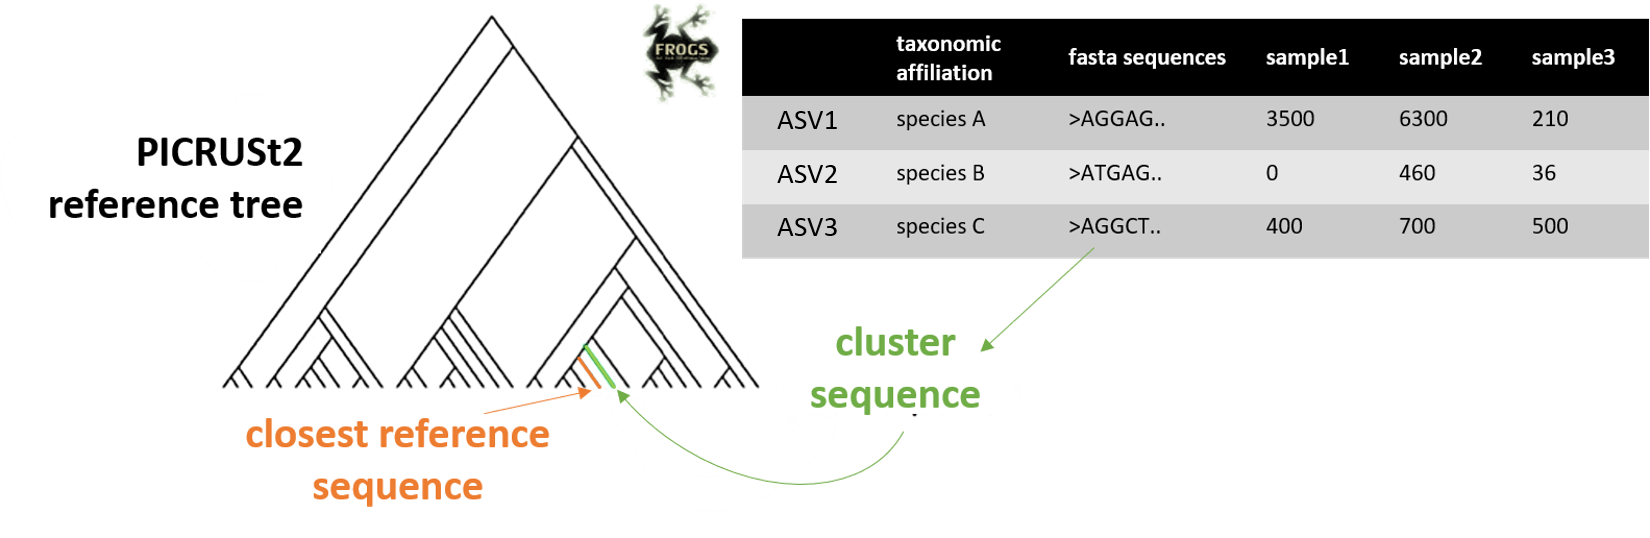
FROGSfunc placeseqs and copynumber
FROGSfunc functions
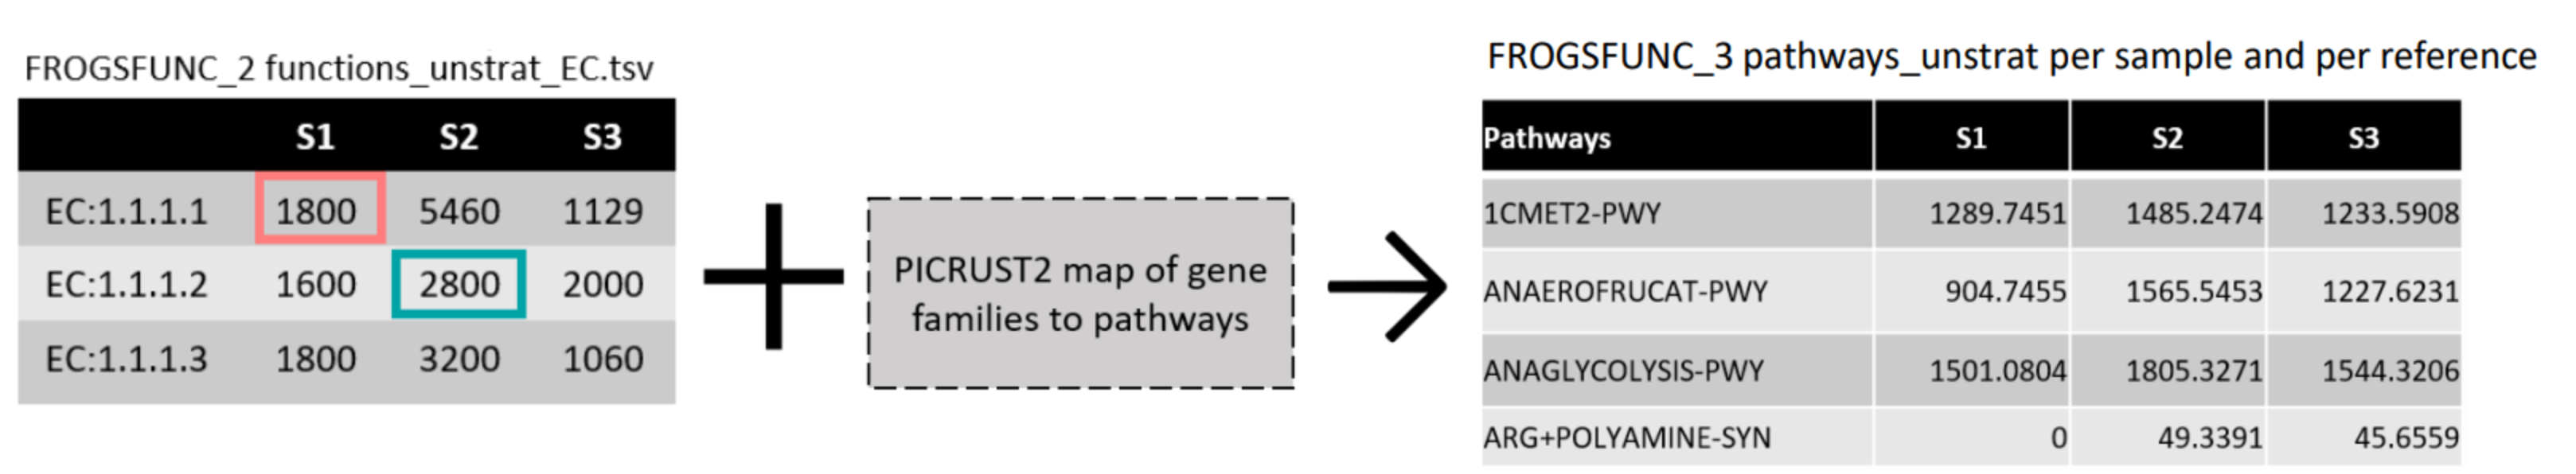
FROGSfunc pathways
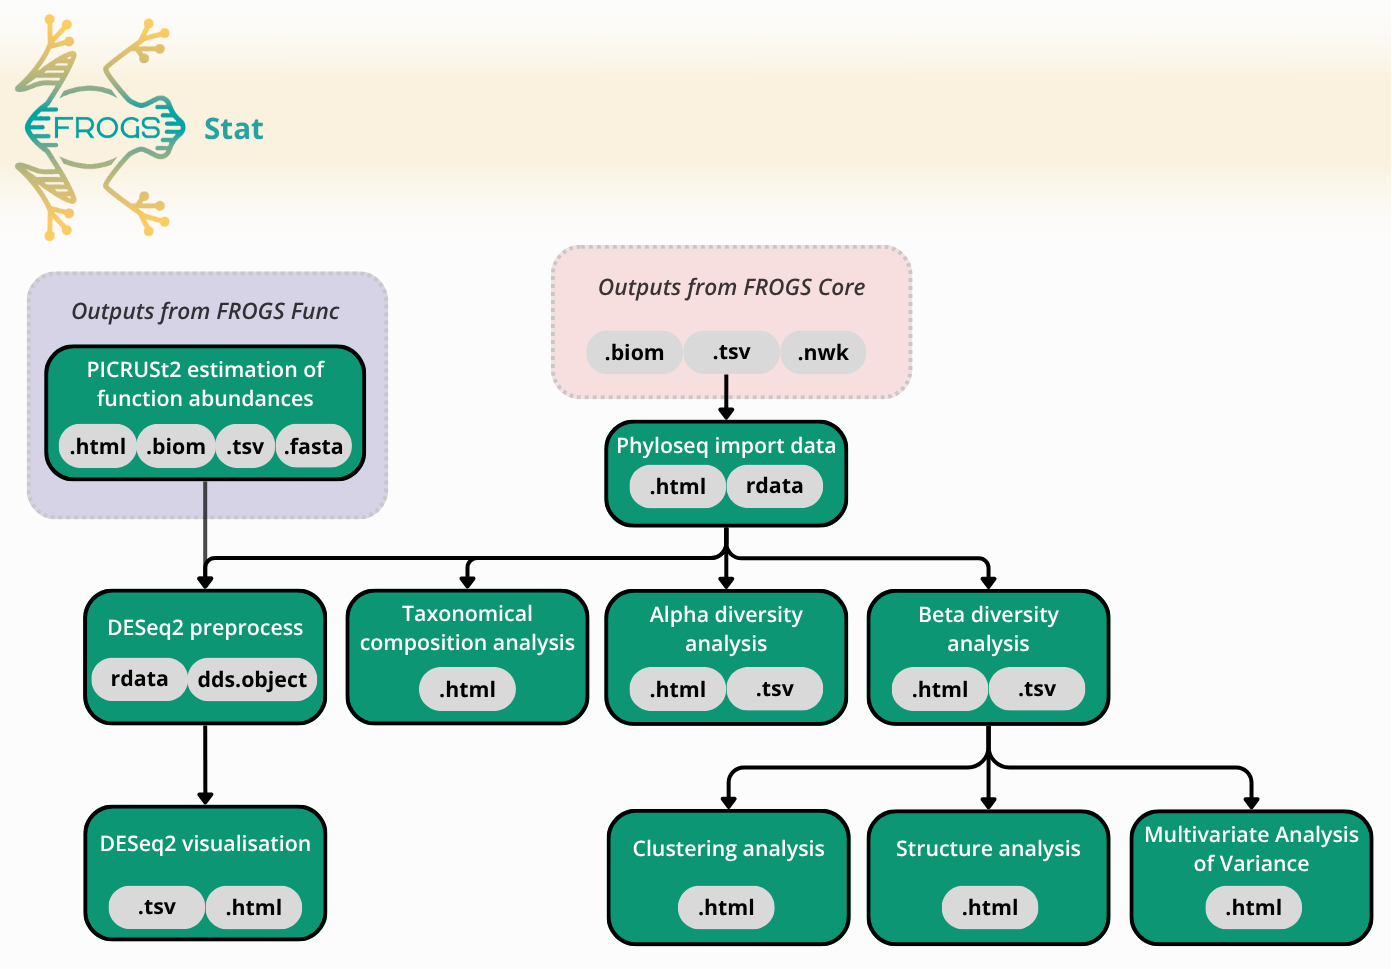
FROGS Stat: Exploring diversity
References

1. Escudié F, Auer L, Bernard M, Mariadassou M, Cauquil L, Vidal K, et al. FROGS: Find, Rapidly, OTUs with Galaxy Solution. Bioinformatics. 2018;34:1287–94. doi:10.1093/bioinformatics/btx791.
2. Bernard M, Rué O, Mariadassou M, Pascal G. FROGS: a powerful tool to analyse the diversity of fungi with special management of internal transcribed spacers. Briefings in Bioinformatics. 2021;22. doi:10.1093/bib/bbab318.
3. Stoler N, Nekrutenko A. Sequencing error profiles of Illumina sequencing instruments. NAR Genomics and Bioinformatics. 2021;3. doi:10.1093/nargab/lqab019.
4. Rognes T, Flouri T, Nichols B, Quince C, Mahé F. VSEARCH: A versatile open source tool for metagenomics. PeerJ. 2016;4:e2584.
5. Magoč T, Salzberg SL. FLASH: Fast length adjustment of short reads to improve genome assemblies. Bioinformatics. 2011;27:2957–63.
6. Zhang J, Kobert K, Flouri T, Stamatakis A. PEAR: A fast and accurate illumina paired-end reAd mergeR. Bioinformatics. 2013;30:614–20.
7. Martin M. Cutadapt removes adapter sequences from high-throughput sequencing reads. EMBnetjournal. 2011;17:10–2. doi:10.14806/ej.17.1.200.
8. Mahé F, Rognes T, Quince C, Vargas C de, Dunthorn M. Swarm v2: Highly-scalable and high-resolution amplicon clustering. PeerJ. 2015;3:e1420.
9. Callahan BJ, McMurdie PJ, Rosen MJ, Han AW, Johnson AJA, Holmes SP. DADA2: High-resolution sample inference from illumina amplicon data. Nature methods. 2016;13:581.
10. Hakimzadeh A, Abdala Asbun A, Albanese D, Bernard M, Buchner D, Callahan B, et al. A pile of pipelines: An overview of the bioinformatics software for metabarcoding data analyses. Molecular Ecology Resources. 2023.
11. Couton M, Baud A, Daguin-Thiébaut C, Corre E, Comtet T, Viard F. High-throughput sequencing on preservative ethanol is effective at jointly examining infraspecific and taxonomic diversity, although bioinformatics pipelines do not perform equally. Ecology and Evolution. 2021;11:5533–46.
12. De Santiago A, Pereira TJ, Mincks SL, Bik HM. Dataset complexity impacts both MOTU delimitation and biodiversity estimates in eukaryotic 18S rRNA metabarcoding studies. Environmental DNA. 2022;4:363–84.
13. Group JCHMPDGW. Evaluation of 16S rDNA-based community profiling for human microbiome research. PloS one. 2012;7:e39315.
14. Murali A, Bhargava A, Wright ES. IDTAXA: A novel approach for accurate taxonomic classification of microbiome sequences. Microbiome. 2018;6:1–14.
15. Douglas GM, Maffei VJ, Zaneveld JR, Yurgel SN, Brown JR, Taylor CM, et al. PICRUSt2 for prediction of metagenome functions. Nature biotechnology. 2020;38:685–8.